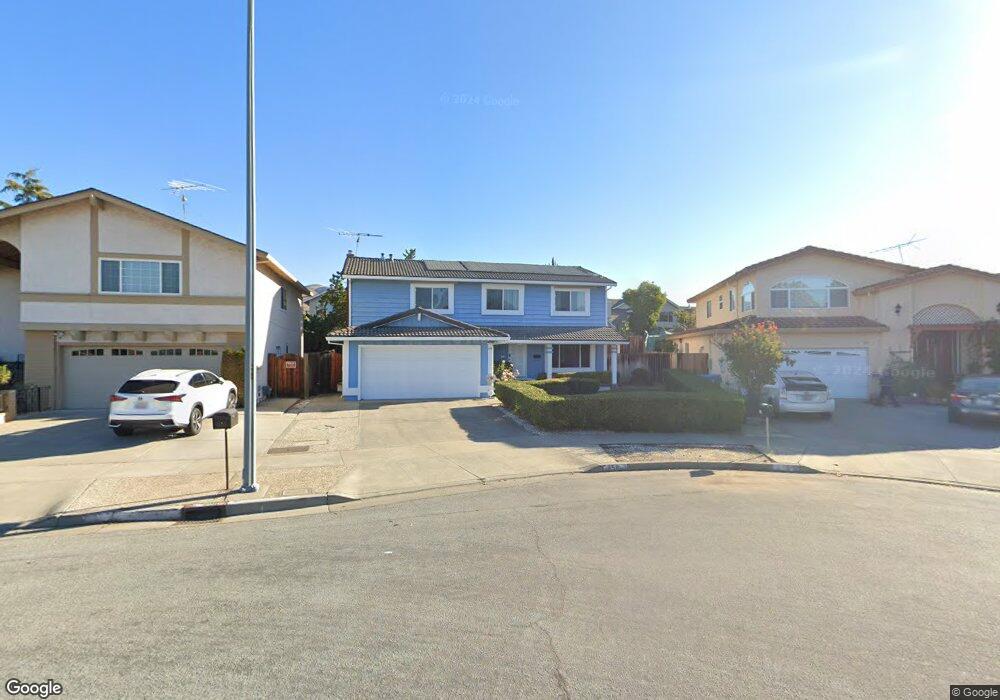
858 Viceroy Way San Jose, CA 95133
Penitencia NeighborhoodEstimated Value: $1,742,582 - $1,945,000
4
Beds
3
Baths
2,090
Sq Ft
$881/Sq Ft
Est. Value
About This Home
This home is located at 858 Viceroy Way, San Jose, CA 95133 and is currently estimated at $1,840,896, approximately $880 per square foot. 858 Viceroy Way is a home located in Santa Clara County with nearby schools including Summerdale Elementary School, Piedmont Middle School, and Independence High School.
Ownership History
Date
Name
Owned For
Owner Type
Purchase Details
Closed on
Mar 15, 1999
Sold by
Andrew Liu and Liu Sarah
Bought by
Dao Andy and Yeung Grace K
Current Estimated Value
Home Financials for this Owner
Home Financials are based on the most recent Mortgage that was taken out on this home.
Original Mortgage
$240,000
Outstanding Balance
$57,986
Interest Rate
6.73%
Estimated Equity
$1,782,910
Purchase Details
Closed on
Jan 20, 1998
Sold by
Andrew Liu
Bought by
Liu Andrew and Liu Sarah
Home Financials for this Owner
Home Financials are based on the most recent Mortgage that was taken out on this home.
Original Mortgage
$227,150
Interest Rate
7.13%
Create a Home Valuation Report for This Property
The Home Valuation Report is an in-depth analysis detailing your home's value as well as a comparison with similar homes in the area
Home Values in the Area
Average Home Value in this Area
Purchase History
| Date | Buyer | Sale Price | Title Company |
|---|---|---|---|
| Dao Andy | $385,000 | North American Title Co | |
| Liu Andrew | -- | Golden California Title Co |
Source: Public Records
Mortgage History
| Date | Status | Borrower | Loan Amount |
|---|---|---|---|
| Open | Dao Andy | $240,000 | |
| Previous Owner | Liu Andrew | $227,150 |
Source: Public Records
Tax History Compared to Growth
Tax History
| Year | Tax Paid | Tax Assessment Tax Assessment Total Assessment is a certain percentage of the fair market value that is determined by local assessors to be the total taxable value of land and additions on the property. | Land | Improvement |
|---|---|---|---|---|
| 2025 | $8,922 | $603,151 | $235,144 | $368,007 |
| 2024 | $8,922 | $591,326 | $230,534 | $360,792 |
| 2023 | $8,751 | $579,732 | $226,014 | $353,718 |
| 2022 | $8,712 | $568,366 | $221,583 | $346,783 |
| 2021 | $8,420 | $557,223 | $217,239 | $339,984 |
| 2020 | $8,153 | $551,510 | $215,012 | $336,498 |
| 2019 | $7,840 | $540,697 | $210,797 | $329,900 |
| 2018 | $7,724 | $530,096 | $206,664 | $323,432 |
| 2017 | $7,763 | $519,703 | $202,612 | $317,091 |
| 2016 | $7,438 | $509,514 | $198,640 | $310,874 |
| 2015 | $7,349 | $501,862 | $195,657 | $306,205 |
| 2014 | $6,694 | $492,032 | $191,825 | $300,207 |
Source: Public Records
Map
Nearby Homes
- 2806 Glauser Dr
- 693 Kirk Glen Dr
- 673 Kirk Glen Dr
- 2714 Mabury Square
- 3092 Halgrim Ct
- 825 N Capitol Ave Unit 4
- 994 Harcot Ct
- 982 Harcot Ct
- 981 Harcot Ct
- 998 Harcot Ct
- 997 Harcot Ct
- Residence 2 Plan at Ascend
- Residence 1 Plan at Ascend
- Residence 3 Plan at Ascend
- 714 N Capitol Ave
- 1055 N Capitol Ave Unit 124
- 1055 N Capitol Ave Unit 180
- 1055 N Capitol Ave Unit 51
- 970 E Harcot Ct
- 985 Harcot Ct
- 862 Viceroy Way
- 854 Viceroy Way
- 867 Salt Lake Dr
- 871 Salt Lake Dr
- 863 Salt Lake Dr
- 859 Salt Lake Dr
- 875 Salt Lake Dr
- 850 Viceroy Way
- 866 Viceroy Way
- 877 Salt Lake Dr
- 851 Salt Lake Dr
- 879 Salt Lake Dr
- 847 Salt Lake Dr
- 846 Viceroy Way
- 863 Salt Lake Ct
- 863 Viceroy Way
- 870 Viceroy Way
- 881 Salt Lake Dr
- 867 Viceroy Way
- 843 Salt Lake Dr