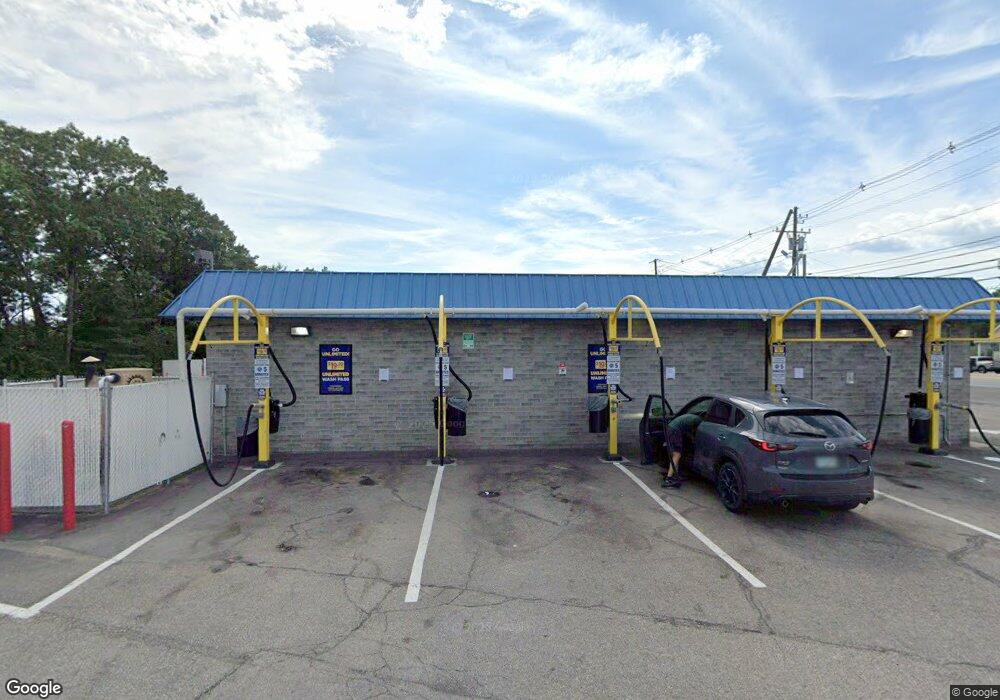
86 Broad St Nashua, NH 03064
North End Nashua NeighborhoodEstimated Value: $1,140,103
--
Bed
--
Bath
3,840
Sq Ft
$297/Sq Ft
Est. Value
About This Home
This home is located at 86 Broad St, Nashua, NH 03064 and is currently estimated at $1,140,103, approximately $296 per square foot. 86 Broad St is a home located in Hillsborough County with nearby schools including Amherst Street School, Pennichuck Middle School, and Nashua High School North.
Ownership History
Date
Name
Owned For
Owner Type
Purchase Details
Closed on
Nov 11, 2021
Sold by
Highland Group Llc
Bought by
Nouria Energy Nh Rlty Llc
Current Estimated Value
Purchase Details
Closed on
Dec 30, 2005
Sold by
International Prop T
Bought by
Highland Group Llc
Home Financials for this Owner
Home Financials are based on the most recent Mortgage that was taken out on this home.
Original Mortgage
$1,280,000
Interest Rate
6.39%
Mortgage Type
Commercial
Purchase Details
Closed on
Dec 12, 2002
Sold by
Lucky Duck Car Wash In
Bought by
International Props T
Home Financials for this Owner
Home Financials are based on the most recent Mortgage that was taken out on this home.
Original Mortgage
$650,000
Interest Rate
6.17%
Mortgage Type
Commercial
Create a Home Valuation Report for This Property
The Home Valuation Report is an in-depth analysis detailing your home's value as well as a comparison with similar homes in the area
Home Values in the Area
Average Home Value in this Area
Purchase History
| Date | Buyer | Sale Price | Title Company |
|---|---|---|---|
| Nouria Energy Nh Rlty Llc | $900,000 | None Available | |
| Highland Group Llc | $1,350,000 | -- | |
| International Props T | $900,000 | -- |
Source: Public Records
Mortgage History
| Date | Status | Borrower | Loan Amount |
|---|---|---|---|
| Previous Owner | International Props T | $1,280,000 | |
| Previous Owner | International Props T | $650,000 |
Source: Public Records
Tax History Compared to Growth
Tax History
| Year | Tax Paid | Tax Assessment Tax Assessment Total Assessment is a certain percentage of the fair market value that is determined by local assessors to be the total taxable value of land and additions on the property. | Land | Improvement |
|---|---|---|---|---|
| 2024 | $18,050 | $1,135,200 | $439,100 | $696,100 |
| 2023 | $18,287 | $1,003,100 | $382,100 | $621,000 |
| 2022 | $18,126 | $1,003,100 | $382,100 | $621,000 |
| 2021 | $25,270 | $1,088,300 | $383,900 | $704,400 |
| 2020 | $24,606 | $1,088,300 | $383,900 | $704,400 |
| 2019 | $23,681 | $1,088,300 | $383,900 | $704,400 |
| 2018 | $23,083 | $1,088,300 | $383,900 | $704,400 |
| 2017 | $20,176 | $782,300 | $321,700 | $460,600 |
| 2016 | $19,612 | $782,300 | $321,700 | $460,600 |
| 2015 | $19,190 | $782,300 | $321,700 | $460,600 |
| 2014 | $18,973 | $788,900 | $321,700 | $467,200 |
Source: Public Records
Map
Nearby Homes
- 44 Broad St
- 3 Wright Rd
- 11 Amherst Terrace
- 31 Ashland St
- 19 Dunloggin Rd
- 0 Baldwin St
- 7 Bitirnas St Unit U7
- 239 Broad St
- 7 Robert Dr
- 30 Burgess St
- 33 Ferry Rd
- 74 Profile Cir
- 17 Danbury Rd
- 4 Reservoir St
- 11 Charles St
- 123 Cannongate III
- 31 Juliana Ave
- 31 Juliana Ave Unit 4
- 3 Opal Way Unit 3
- 1 Opal Way Unit 1