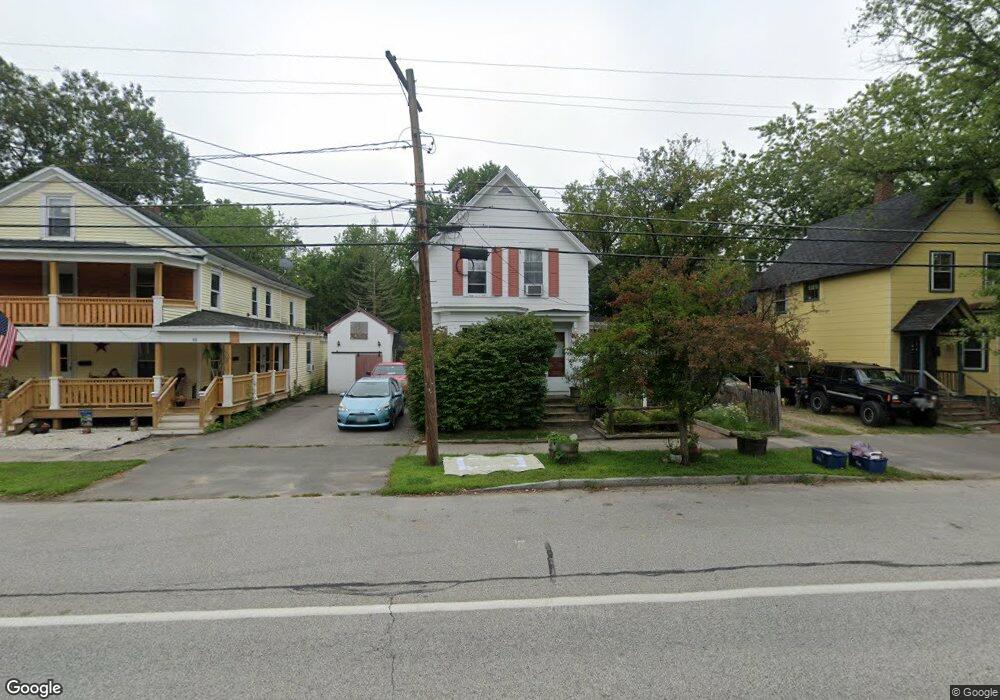
86 Broadway Concord, NH 03301
South End NeighborhoodEstimated Value: $339,907 - $440,000
2
Beds
1
Bath
1,397
Sq Ft
$284/Sq Ft
Est. Value
About This Home
This home is located at 86 Broadway, Concord, NH 03301 and is currently estimated at $396,727, approximately $283 per square foot. 86 Broadway is a home located in Merrimack County with nearby schools including Abbot-Downing School, Rundlett Middle School, and Concord High School.
Ownership History
Date
Name
Owned For
Owner Type
Purchase Details
Closed on
Jul 21, 2009
Sold by
Mattice Wayne S
Bought by
Belval Kevin G
Current Estimated Value
Home Financials for this Owner
Home Financials are based on the most recent Mortgage that was taken out on this home.
Original Mortgage
$134,000
Outstanding Balance
$86,016
Interest Rate
5.31%
Mortgage Type
Purchase Money Mortgage
Estimated Equity
$310,711
Create a Home Valuation Report for This Property
The Home Valuation Report is an in-depth analysis detailing your home's value as well as a comparison with similar homes in the area
Home Values in the Area
Average Home Value in this Area
Purchase History
| Date | Buyer | Sale Price | Title Company |
|---|---|---|---|
| Belval Kevin G | $167,500 | -- |
Source: Public Records
Mortgage History
| Date | Status | Borrower | Loan Amount |
|---|---|---|---|
| Open | Belval Kevin G | $134,000 |
Source: Public Records
Tax History
| Year | Tax Paid | Tax Assessment Tax Assessment Total Assessment is a certain percentage of the fair market value that is determined by local assessors to be the total taxable value of land and additions on the property. | Land | Improvement |
|---|---|---|---|---|
| 2025 | $5,985 | $205,600 | $102,600 | $103,000 |
| 2024 | $5,693 | $205,600 | $102,600 | $103,000 |
| 2023 | $5,490 | $204,400 | $102,600 | $101,800 |
| 2022 | $5,292 | $204,400 | $102,600 | $101,800 |
| 2021 | $5,330 | $212,200 | $102,600 | $109,600 |
| 2020 | $5,082 | $189,900 | $85,900 | $104,000 |
| 2019 | $4,828 | $173,800 | $86,600 | $87,200 |
| 2018 | $5,332 | $168,600 | $86,600 | $82,000 |
| 2017 | $4,569 | $161,800 | $85,000 | $76,800 |
| 2016 | $4,339 | $156,800 | $85,000 | $71,800 |
| 2015 | $4,175 | $144,500 | $74,300 | $70,200 |
| 2014 | $3,874 | $144,500 | $74,300 | $70,200 |
| 2013 | -- | $143,800 | $74,300 | $69,500 |
| 2012 | -- | $149,900 | $74,300 | $75,600 |
Source: Public Records
Map
Nearby Homes
- 0 South St Unit 4969509
- 335 S Main St
- 273-279 S Main St
- 47 Noyes St
- 33 Joffre St
- 47 South St
- 40 Nivelle St
- 111 -113 South Main St
- 58 S State St
- 289 South St
- 7-9 Myrtle St
- 30 Longmeadow Dr
- 25 N Spring St
- 22 Fairfield Dr
- 21 Fairfield Dr
- 20 Fairfield Dr
- 9 Forest St
- 135 Liberty St
- 15 Wyman St Unit 9
- 5 Holly Cir
- 88 Broadway Unit 90
- 84 Broadway
- 29 Stone St Unit 31
- 29-31-31 Stone St Unit 29
- 29-31-31 Stone St Unit 31
- 85 Broadway
- 89 Broadway
- 91 Broadway
- 82B Broadway
- 28 Stone St
- 35 Stone St
- 23 Stone St
- 23 Stone Street Extension
- 32 Stone St
- 37 Stone St
- 81 Broadway
- 80 Broadway
- 21 Stone Street Extension
- 36 Stone St
- 39 Stone St
Your Personal Tour Guide
Ask me questions while you tour the home.