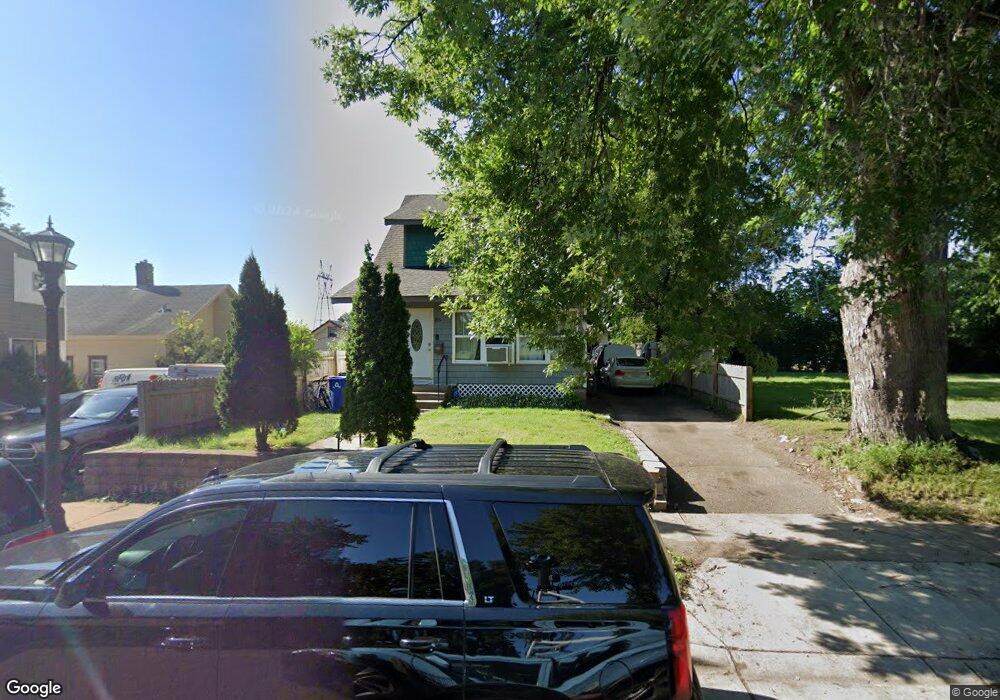
86 Sycamore St E Saint Paul, MN 55117
North End NeighborhoodEstimated Value: $219,000 - $247,000
3
Beds
1
Bath
1,128
Sq Ft
$205/Sq Ft
Est. Value
About This Home
This home is located at 86 Sycamore St E, Saint Paul, MN 55117 and is currently estimated at $230,948, approximately $204 per square foot. 86 Sycamore St E is a home located in Ramsey County with nearby schools including Bruce F Vento Elementary School, Washington Technology Magnet School, and Water Lily Montessori.
Ownership History
Date
Name
Owned For
Owner Type
Purchase Details
Closed on
Mar 25, 2022
Sold by
Meemeh Maria and Reh Nga
Bought by
Penaloza Elisabel
Current Estimated Value
Home Financials for this Owner
Home Financials are based on the most recent Mortgage that was taken out on this home.
Original Mortgage
$196,377
Outstanding Balance
$182,997
Interest Rate
3.69%
Mortgage Type
New Conventional
Estimated Equity
$47,951
Purchase Details
Closed on
Mar 21, 2022
Sold by
Meemeh and Mee
Bought by
Penaloza Elisabel
Home Financials for this Owner
Home Financials are based on the most recent Mortgage that was taken out on this home.
Original Mortgage
$196,377
Outstanding Balance
$182,997
Interest Rate
3.69%
Mortgage Type
New Conventional
Estimated Equity
$47,951
Purchase Details
Closed on
Oct 25, 2017
Sold by
Walker Jonathan B and Starnes Kimberley L
Bought by
Meh Mee and Reh Nga
Home Financials for this Owner
Home Financials are based on the most recent Mortgage that was taken out on this home.
Original Mortgage
$117,520
Interest Rate
3.78%
Mortgage Type
New Conventional
Create a Home Valuation Report for This Property
The Home Valuation Report is an in-depth analysis detailing your home's value as well as a comparison with similar homes in the area
Home Values in the Area
Average Home Value in this Area
Purchase History
| Date | Buyer | Sale Price | Title Company |
|---|---|---|---|
| Penaloza Elisabel | $200,000 | -- | |
| Penaloza Elisabel | $200,000 | Executive Title Services | |
| Meh Mee | $146,900 | The Title Group Inc |
Source: Public Records
Mortgage History
| Date | Status | Borrower | Loan Amount |
|---|---|---|---|
| Open | Penaloza Elisabel | $196,377 | |
| Closed | Penaloza Elisabel | $196,377 | |
| Previous Owner | Meh Mee | $117,520 |
Source: Public Records
Tax History
| Year | Tax Paid | Tax Assessment Tax Assessment Total Assessment is a certain percentage of the fair market value that is determined by local assessors to be the total taxable value of land and additions on the property. | Land | Improvement |
|---|---|---|---|---|
| 2025 | $2,966 | $216,900 | $25,000 | $191,900 |
| 2023 | $2,966 | $195,600 | $20,000 | $175,600 |
| 2022 | $2,448 | $184,200 | $20,000 | $164,200 |
| 2021 | $2,252 | $167,300 | $20,000 | $147,300 |
| 2020 | $2,396 | $160,800 | $8,300 | $152,500 |
| 2019 | $1,914 | $150,200 | $8,300 | $141,900 |
| 2018 | $1,406 | $125,800 | $10,400 | $115,400 |
| 2017 | $1,558 | $106,500 | $10,400 | $96,100 |
| 2016 | $1,314 | $0 | $0 | $0 |
| 2015 | $1,308 | $76,000 | $10,400 | $65,600 |
| 2014 | $1,632 | $0 | $0 | $0 |
Source: Public Records
Map
Nearby Homes
- 116 Sycamore St E
- 120 Granite St
- 16 Sycamore St E
- 9 Acker St W
- 184 Granite St
- 177 Granite St
- 112 York Ave
- 36 Winnipeg Ave
- 46 Winnipeg Ave
- 820 Capitol Heights
- 137 Sims Ave
- 25 Winter St
- 89 Winnipeg Ave
- 109 Atwater St
- 821 Hardenbergh Place
- 823 Hardenbergh Place
- 930 Albemarle St
- 922 N Woodbridge St
- 370 Atwater St W
- 417 Mount Ida St
- 779 Cortland Place
- 773 Cortland Place
- 765 Cortland Place
- 87 Acker St E
- 72 Sycamore St E
- 87 Acker-Street-e
- 766 Jackson St
- 780 Jackson St
- 65 Acker St E
- 99 Acker St E
- 756 Jackson St
- 756 Jackson St
- 756 Jackson St
- 101 Acker St E
- 76 Acker St E
- 111 Acker St E
- 116 116 Sycamore-Street-e
- 109 Acker St E
- 101 Sycamore St E
- 102 Acker St E
Your Personal Tour Guide
Ask me questions while you tour the home.