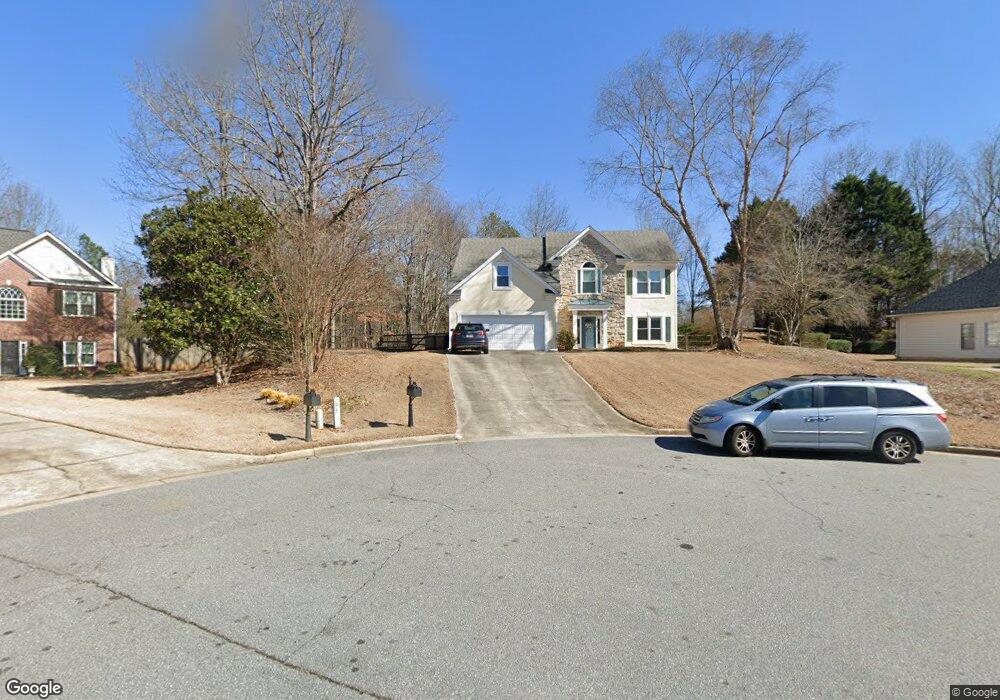
860 Cedar Creek Dr Suwanee, GA 30024
Estimated Value: $565,000 - $633,000
4
Beds
3
Baths
2,599
Sq Ft
$228/Sq Ft
Est. Value
About This Home
This home is located at 860 Cedar Creek Dr, Suwanee, GA 30024 and is currently estimated at $591,406, approximately $227 per square foot. 860 Cedar Creek Dr is a home located in Forsyth County with nearby schools including Settles Bridge Elementary School, Riverwatch Middle School, and Lambert High School.
Ownership History
Date
Name
Owned For
Owner Type
Purchase Details
Closed on
Apr 30, 2007
Sold by
Fahey Patrick J and Fahey Jennifer E
Bought by
Pickering Lance F and Pickering Caroline P
Current Estimated Value
Home Financials for this Owner
Home Financials are based on the most recent Mortgage that was taken out on this home.
Original Mortgage
$261,000
Outstanding Balance
$158,151
Interest Rate
6.1%
Mortgage Type
New Conventional
Estimated Equity
$433,255
Purchase Details
Closed on
May 29, 1997
Sold by
James Callas Inc
Bought by
Fahey Patrick J and Fahey Jennifer E
Home Financials for this Owner
Home Financials are based on the most recent Mortgage that was taken out on this home.
Original Mortgage
$154,850
Interest Rate
8.13%
Mortgage Type
New Conventional
Purchase Details
Closed on
Jan 17, 1997
Sold by
Callas Devel Co
Bought by
Callasinc James
Create a Home Valuation Report for This Property
The Home Valuation Report is an in-depth analysis detailing your home's value as well as a comparison with similar homes in the area
Home Values in the Area
Average Home Value in this Area
Purchase History
| Date | Buyer | Sale Price | Title Company |
|---|---|---|---|
| Pickering Lance F | $290,000 | -- | |
| Fahey Patrick J | $163,000 | -- | |
| Callasinc James | $32,000 | -- | |
| Callasinc James | $32,000 | -- |
Source: Public Records
Mortgage History
| Date | Status | Borrower | Loan Amount |
|---|---|---|---|
| Open | Pickering Lance F | $261,000 | |
| Previous Owner | Fahey Patrick J | $154,850 | |
| Closed | Callasinc James | $0 |
Source: Public Records
Tax History Compared to Growth
Tax History
| Year | Tax Paid | Tax Assessment Tax Assessment Total Assessment is a certain percentage of the fair market value that is determined by local assessors to be the total taxable value of land and additions on the property. | Land | Improvement |
|---|---|---|---|---|
| 2025 | $4,004 | $213,312 | $72,000 | $141,312 |
| 2024 | $4,004 | $197,552 | $60,000 | $137,552 |
| 2023 | $3,650 | $197,104 | $60,000 | $137,104 |
| 2022 | $3,602 | $127,964 | $32,800 | $95,164 |
| 2021 | $3,211 | $127,964 | $32,800 | $95,164 |
| 2020 | $3,105 | $122,824 | $32,800 | $90,024 |
| 2019 | $3,061 | $120,484 | $32,800 | $87,684 |
| 2018 | $3,004 | $117,188 | $32,800 | $84,388 |
| 2017 | $2,736 | $103,980 | $32,800 | $71,180 |
| 2016 | $2,736 | $103,980 | $32,800 | $71,180 |
| 2015 | $2,741 | $103,980 | $32,800 | $71,180 |
| 2014 | $2,086 | $82,084 | $24,000 | $58,084 |
Source: Public Records
Map
Nearby Homes
- 740 Mayfair Ct
- 245 Mayfair Ct
- 255 Mayfair Ct
- 940 Ambleside Dr
- 1750 Cone Flower Way
- 1580 Bramble Bush Way
- 1565 Bramble Bush Way
- 451 Nichols Dr
- 510 Hammersmith Dr
- 4050 Homestead Ridge Dr
- 410 Blackwood Ln
- 1445 Thunder Gulch Pass
- 4805 Shelbourne Dr
- 640 Rockbass Rd
- 4345 Mantle Ridge Dr
- 1310 Settles Rd
- 1610 Apollo Dr
- 715 Moonlight Way
- 1140 Deborah Ln
- 7065 Laurel Oak Dr
- 840 Cedar Creek Dr
- 870 Cedar Creek Dr
- 875 Cedar Creek Dr
- 830 Cedar Creek Dr
- 865 Cedar Creek Dr
- 820 Cedar Creek Dr
- 855 Cedar Creek Dr
- 387 Nichols Rd
- 835 Cedar Creek Dr
- 845 Cedar Creek Dr
- 810 Cedar Creek Dr
- 825 Cedar Creek Dr Unit 23
- 825 Cedar Creek Dr
- 825 Cedar Creek Ct
- 345 Nichols Rd
- 815 Cedar Creek Dr
- 0 Nichols Rd Unit 8138049
- Lot 4 Nichols Rd Unit 4
- Lot 4 Nichols Rd
- 835 Cedar Creek Ct