
Seller's Agent in 2026
Andrew Watson
Wedgewood Homes Realty
(208) 994-6978
3 in this area
44 Total Sales
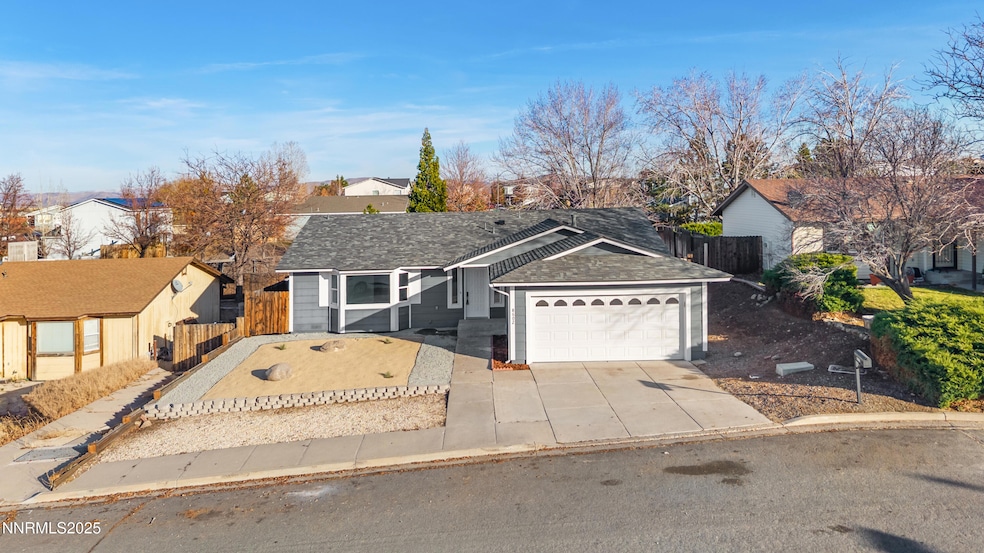
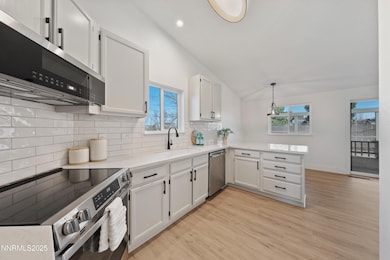
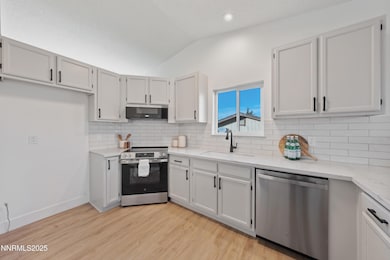


Welcome to 8602 Strutter Way — a beautifully updated single-story home located in one of Reno's most desirable and convenient neighborhoods. This turnkey property features a bright, open floor plan with generous natural light, vaulted ceilings, and thoughtful upgrades throughout. The spacious living area flows seamlessly into the dining space and updated kitchen, complete with stainless steel appliances, ample cabinetry, and a functional layout ideal for daily living and entertaining. The primary suite offers comfort and privacy with a large walk-in closet and en-suite bath. Two additional bedrooms provide flexibility for guests, a home office, or family needs. Step outside to a low-maintenance backyard perfect for relaxing, pets, or outdoor dining, with enough space to create your ideal outdoor retreat. Additional highlights include an attached two-car garage, fresh interior finishes, a dedicated laundry area, and a location just minutes from shopping, restaurants, parks, top-rated schools, and freeway access. Come see why 8602 Strutter Way is the perfect blend of comfort, convenience, and Nevada living.
Last Agent to Sell the Property
Wedgewood Homes Realty License #B.1003098 Listed on: 02/02/2026
| Date | Type | Sale Price | Title Company |
|---|---|---|---|
| Bargain Sale Deed | $449,000 | Stewart Title | |
| Bargain Sale Deed | $278,000 | Core Title Group | |
| Interfamily Deed Transfer | -- | First Centennial Title Co | |
| Deed | $113,000 | First Centennial Title Co | |
| Grant Deed | -- | First Centennial Title Co |
| Date | Status | Loan Amount | Loan Type |
|---|---|---|---|
| Open | $440,867 | FHA | |
| Previous Owner | $109,100 | No Value Available | |
| Previous Owner | $112,888 | FHA |
| Date | Event | Price | List to Sale | Price per Sq Ft |
|---|---|---|---|---|
| 01/31/2026 01/31/26 | Off Market | $449,900 | -- | -- |
| 01/30/2026 01/30/26 | Sold | $449,900 | 0.0% | $287 / Sq Ft |
| 11/26/2025 11/26/25 | For Sale | $449,900 | -- | $287 / Sq Ft |
| Year | Tax Paid | Tax Assessment Tax Assessment Total Assessment is a certain percentage of the fair market value that is determined by local assessors to be the total taxable value of land and additions on the property. | Land | Improvement |
|---|---|---|---|---|
| 2026 | $754 | $67,749 | $31,430 | $36,319 |
| 2025 | $1,470 | $69,407 | $31,955 | $37,452 |
| 2024 | $1,428 | $65,613 | $27,475 | $38,138 |
| 2023 | $1,428 | $65,258 | $28,770 | $36,488 |
| 2022 | $1,386 | $53,023 | $22,365 | $30,658 |
| 2021 | $1,346 | $48,474 | $17,640 | $30,834 |
| 2020 | $1,306 | $47,623 | $16,415 | $31,208 |
| 2019 | $1,268 | $47,202 | $16,835 | $30,367 |
| 2018 | $1,182 | $40,535 | $11,935 | $28,600 |
| 2017 | $1,149 | $38,866 | $10,010 | $28,856 |
| 2016 | $1,119 | $38,661 | $8,925 | $29,736 |
| 2015 | $1,117 | $37,839 | $7,945 | $29,894 |
| 2014 | $1,085 | $34,520 | $5,705 | $28,815 |
| 2013 | -- | $28,660 | $4,270 | $24,390 |
Seller's Agent in 2026
Andrew Watson
Wedgewood Homes Realty
(208) 994-6978
3 in this area
44 Total Sales
Buyer's Agent in 2026
Lolis Vazquez
Reno Sparks Realty, LLC
(775) 771-2537
30 in this area
248 Total Sales
Source: Northern Nevada Regional MLS
MLS Number: 250058586
APN: 090-111-15
Disclaimer: Certain information contained herein is derived from information provided by parties other than Homes.com. All information provided is deemed reliable, but is not guaranteed to be accurate and should be independently verified.
![]() IDX information is provided exclusively for personal, non-commercial use, and may not be used for any purpose other than to identify prospective properties consumers may be interested in purchasing. Information is deemed reliable but not guaranteed. The content relating to real estate for sale on this web site comes in part from the Broker Reciprocity/ IDX program of the Northern Nevada Regional Multiple Listing Service°. Real estate listings held by brokerage firms other than Ten-X are marked with the Broker Reciprocity logo and detailed information about those listings includes the name of the listing brokerage. Any use of the content other than by a search performed by a consumer looking to purchase or rent real estate is prohibited. © 2026 Northern Nevada Regional Multiple Listing Service® MLS. All rights reserved.
IDX information is provided exclusively for personal, non-commercial use, and may not be used for any purpose other than to identify prospective properties consumers may be interested in purchasing. Information is deemed reliable but not guaranteed. The content relating to real estate for sale on this web site comes in part from the Broker Reciprocity/ IDX program of the Northern Nevada Regional Multiple Listing Service°. Real estate listings held by brokerage firms other than Ten-X are marked with the Broker Reciprocity logo and detailed information about those listings includes the name of the listing brokerage. Any use of the content other than by a search performed by a consumer looking to purchase or rent real estate is prohibited. © 2026 Northern Nevada Regional Multiple Listing Service® MLS. All rights reserved.
Ask me questions while you tour the home.