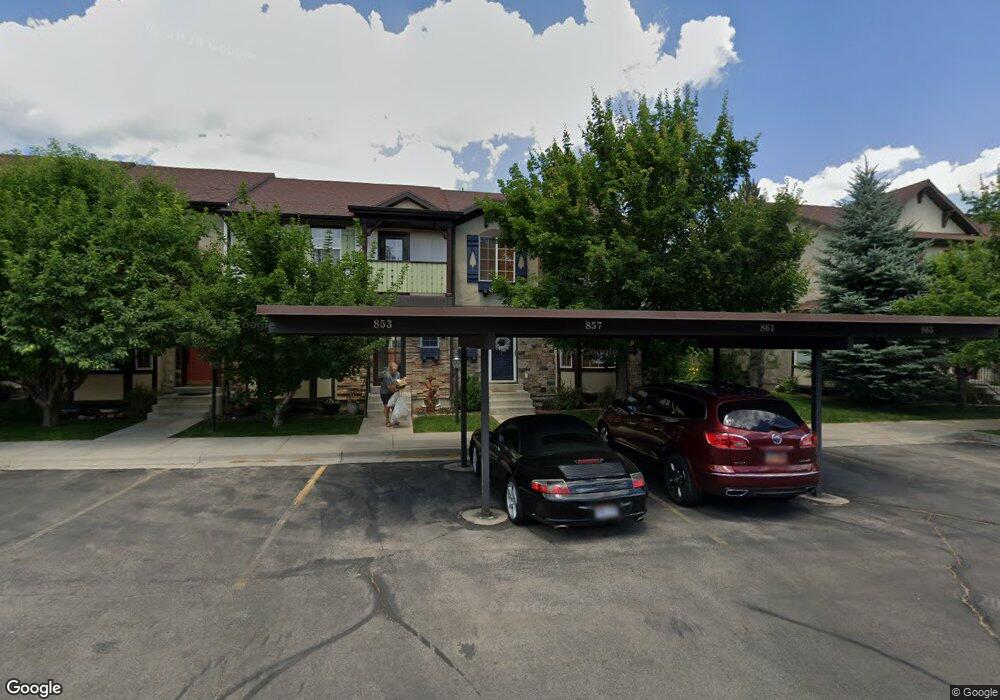
861 E Hamlet Cir S Midway, UT 84049
Estimated Value: $511,000 - $584,000
3
Beds
3
Baths
1,567
Sq Ft
$341/Sq Ft
Est. Value
About This Home
This home is located at 861 E Hamlet Cir S, Midway, UT 84049 and is currently estimated at $534,548, approximately $341 per square foot. 861 E Hamlet Cir S is a home located in Wasatch County with nearby schools including Midway Elementary School, Rocky Mountain Middle School, and Wasatch High School.
Ownership History
Date
Name
Owned For
Owner Type
Purchase Details
Closed on
Dec 8, 2016
Sold by
Brown Lee A
Bought by
Fitzgerland Robyn S
Current Estimated Value
Home Financials for this Owner
Home Financials are based on the most recent Mortgage that was taken out on this home.
Original Mortgage
$194,500
Outstanding Balance
$157,297
Interest Rate
3.57%
Mortgage Type
New Conventional
Estimated Equity
$377,251
Purchase Details
Closed on
Jun 17, 2010
Sold by
Gatch Peter and Gatch Heidi
Bought by
Brown Lee A
Home Financials for this Owner
Home Financials are based on the most recent Mortgage that was taken out on this home.
Original Mortgage
$147,200
Interest Rate
4.79%
Mortgage Type
New Conventional
Purchase Details
Closed on
Feb 16, 2007
Sold by
Georgetown Development Inc
Bought by
Gatch Peter and Gatch Heidi
Create a Home Valuation Report for This Property
The Home Valuation Report is an in-depth analysis detailing your home's value as well as a comparison with similar homes in the area
Home Values in the Area
Average Home Value in this Area
Purchase History
| Date | Buyer | Sale Price | Title Company |
|---|---|---|---|
| Fitzgerland Robyn S | -- | United Title Services | |
| Brown Lee A | -- | Us Title Park City | |
| Gatch Peter | -- | Founders Title Company Heber |
Source: Public Records
Mortgage History
| Date | Status | Borrower | Loan Amount |
|---|---|---|---|
| Open | Fitzgerland Robyn S | $194,500 | |
| Previous Owner | Brown Lee A | $147,200 |
Source: Public Records
Tax History
| Year | Tax Paid | Tax Assessment Tax Assessment Total Assessment is a certain percentage of the fair market value that is determined by local assessors to be the total taxable value of land and additions on the property. | Land | Improvement |
|---|---|---|---|---|
| 2025 | $2,504 | $494,100 | $125,000 | $369,100 |
| 2024 | $2,476 | $494,100 | $125,000 | $369,100 |
| 2023 | $2,476 | $449,000 | $125,000 | $324,000 |
| 2022 | $2,476 | $449,000 | $125,000 | $324,000 |
| 2021 | $2,267 | $317,620 | $80,000 | $237,620 |
| 2020 | $2,338 | $317,620 | $80,000 | $237,620 |
| 2019 | $2,006 | $163,900 | $0 | $0 |
| 2018 | $1,685 | $137,670 | $0 | $0 |
| 2017 | $1,541 | $125,154 | $0 | $0 |
| 2016 | $1,429 | $113,186 | $0 | $0 |
| 2015 | $1,358 | $113,186 | $0 | $0 |
| 2014 | $1,284 | $105,612 | $0 | $0 |
Source: Public Records
Map
Nearby Homes
- 902 E Hamlet Cir S
- 902 E Hamlet Cir N
- 856 Zurich Ln
- 890 E Hamlet Cir N
- 176 Geneva Dr
- 70 Geneva Dr
- 832 E Michie Ln
- 694 E 260 S
- 64 S 450 E
- 215 S 300 E
- 802 E Stone Barn Ln
- 1685 W Midway Ln
- 618 S Fox Den Rd
- 618 S Fox Den Rd Unit 2
- 358 N Whitaker Farm Way
- 296 E 230 N
- 141 S 180 E
- 115 S 100 E
- 115 S 100 E Unit 4
- 103 E Main St
- 865 E Hamlet Cir S
- 857 E Hamlet Cir S
- 853 E Hamlet Cir S
- 875 E Hamlet Cir S
- 862 Zurich Ln
- 862 Zurich Ln Unit 74
- 879 E Hamlet Cir S
- 879 E Hamlet Cir S Unit 131
- 858 Zurich Ln
- 158 Geneva Dr
- 177 S Geneva Dr Unit 177
- 883 E Hamlet Cir S
- 177 Geneva Dr
- 177 Geneva Dr Unit 104
- 173 Geneva Dr
- 173 Geneva Dr Unit 103
- 852 Zurich Ln
- 850 Zurich Ln
- 850 Zurich Ln Unit 78
- 169 Geneva Dr
Your Personal Tour Guide
Ask me questions while you tour the home.