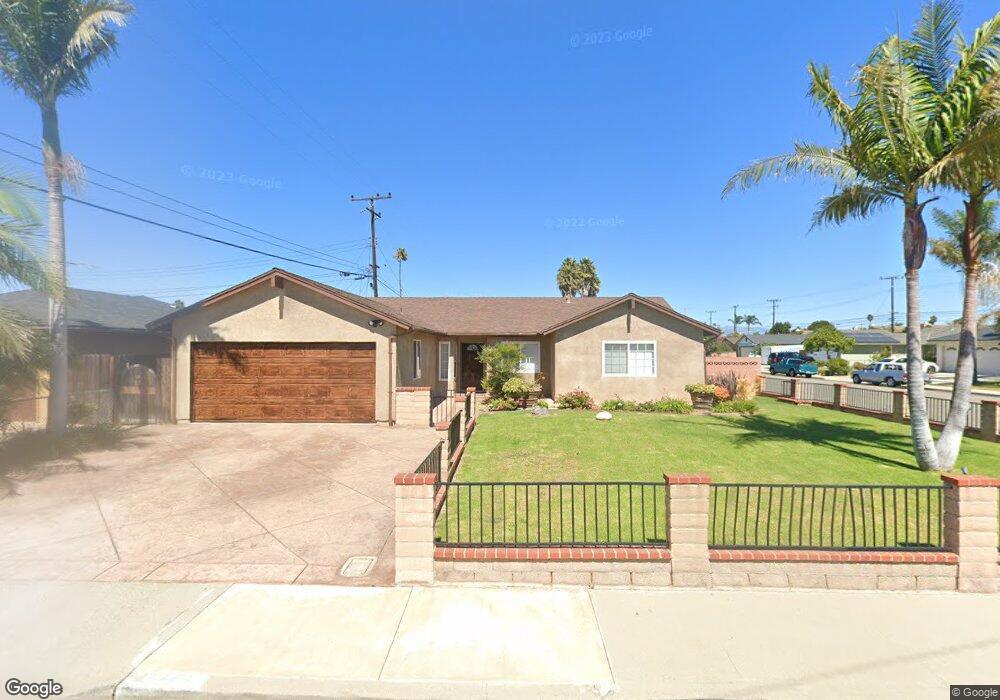
861 E Yucca St Oxnard, CA 93033
Blackstock South NeighborhoodEstimated Value: $643,486 - $736,000
4
Beds
2
Baths
1,276
Sq Ft
$544/Sq Ft
Est. Value
About This Home
This home is located at 861 E Yucca St, Oxnard, CA 93033 and is currently estimated at $694,122, approximately $543 per square foot. 861 E Yucca St is a home located in Ventura County with nearby schools including Fred L. Williams Elementary School and Channel Islands High School.
Ownership History
Date
Name
Owned For
Owner Type
Purchase Details
Closed on
Nov 29, 2000
Sold by
Arroyo Victor M
Bought by
Arroyo Osvaldo and Arroyo Maria G
Current Estimated Value
Home Financials for this Owner
Home Financials are based on the most recent Mortgage that was taken out on this home.
Original Mortgage
$214,234
Interest Rate
7.86%
Mortgage Type
FHA
Purchase Details
Closed on
Oct 23, 2000
Sold by
Borcena Eliseo E and Borcena Vivian C
Bought by
Arroyo Osvaldo and Arroyo Maria G
Home Financials for this Owner
Home Financials are based on the most recent Mortgage that was taken out on this home.
Original Mortgage
$214,234
Interest Rate
7.86%
Mortgage Type
FHA
Purchase Details
Closed on
Aug 21, 1998
Sold by
Borcena Dolores E
Bought by
Borcena Eliseo E and Borcena Vivian C
Home Financials for this Owner
Home Financials are based on the most recent Mortgage that was taken out on this home.
Original Mortgage
$122,750
Interest Rate
6.59%
Purchase Details
Closed on
Jul 15, 1994
Sold by
Borcena Eliseo F and Borcena Dolores E
Bought by
Borcena Eliseo E and Borcena Dolores E
Create a Home Valuation Report for This Property
The Home Valuation Report is an in-depth analysis detailing your home's value as well as a comparison with similar homes in the area
Home Values in the Area
Average Home Value in this Area
Purchase History
| Date | Buyer | Sale Price | Title Company |
|---|---|---|---|
| Arroyo Osvaldo | -- | Chicago Title Co | |
| Arroyo Victor M | -- | Chicago Title Co | |
| Arroyo Osvaldo | $215,000 | Lawyers Title Company | |
| Borcena Eliseo E | $62,500 | Gateway Title Company | |
| Borcena Eliseo E | -- | -- |
Source: Public Records
Mortgage History
| Date | Status | Borrower | Loan Amount |
|---|---|---|---|
| Previous Owner | Arroyo Osvaldo | $214,234 | |
| Previous Owner | Borcena Eliseo E | $122,750 | |
| Closed | Arroyo Osvaldo | $6,480 |
Source: Public Records
Tax History
| Year | Tax Paid | Tax Assessment Tax Assessment Total Assessment is a certain percentage of the fair market value that is determined by local assessors to be the total taxable value of land and additions on the property. | Land | Improvement |
|---|---|---|---|---|
| 2025 | $3,846 | $327,459 | $130,980 | $196,479 |
| 2024 | $3,846 | $321,039 | $128,412 | $192,627 |
| 2023 | $3,619 | $314,745 | $125,895 | $188,850 |
| 2022 | $3,544 | $308,574 | $123,426 | $185,148 |
| 2021 | $3,586 | $302,524 | $121,006 | $181,518 |
| 2020 | $3,650 | $299,423 | $119,766 | $179,657 |
| 2019 | $3,540 | $293,553 | $117,418 | $176,135 |
| 2018 | $3,408 | $287,798 | $115,116 | $172,682 |
| 2017 | $3,297 | $282,156 | $112,859 | $169,297 |
| 2016 | $3,139 | $276,625 | $110,647 | $165,978 |
| 2015 | $3,186 | $272,472 | $108,986 | $163,486 |
| 2014 | $3,127 | $267,137 | $106,852 | $160,285 |
Source: Public Records
Map
Nearby Homes
- 860 Morro Way
- 3130 Paula St
- 3151 Fournier St
- 4340 Highland Ave
- 360 Ibsen Place Unit 129
- 4160 Petit Dr Unit 39
- 3631 La Costa Place
- 320 Columbia Place Unit 46
- 280 Columbia Place Unit 48
- 4200 Browning Dr
- 140 Gaviota Place Unit 157
- 4200 S A St
- 3638 S B St
- 4029 S B St
- 1928 San Benito St
- 5117 Jefferson Square
- 5222 Longfellow Way
- 2117 Cardinal Ave Unit 2117h
- 4032 Mockingbird Ln
- 3700 Olds Rd Unit 86
- 851 E Yucca St
- 850 Morro Way
- 841 E Yucca St
- 3650 San Simeon Ave
- 3640 San Simeon Ave
- 860 E Yucca St
- 3700 San Simeon Ave
- 866 E Yucca St
- 850 E Yucca St
- 3630 San Simeon Ave
- 835 E Yucca St
- 835 E Yucca St
- 845 E Yucca St
- 856 E Yucca St
- 3710 San Simeon Ave
- 840 E Yucca St
- 830 Morro Way
- 3620 San Simeon Ave
- 846 E Yucca St
- 825 E Yucca St
Your Personal Tour Guide
Ask me questions while you tour the home.