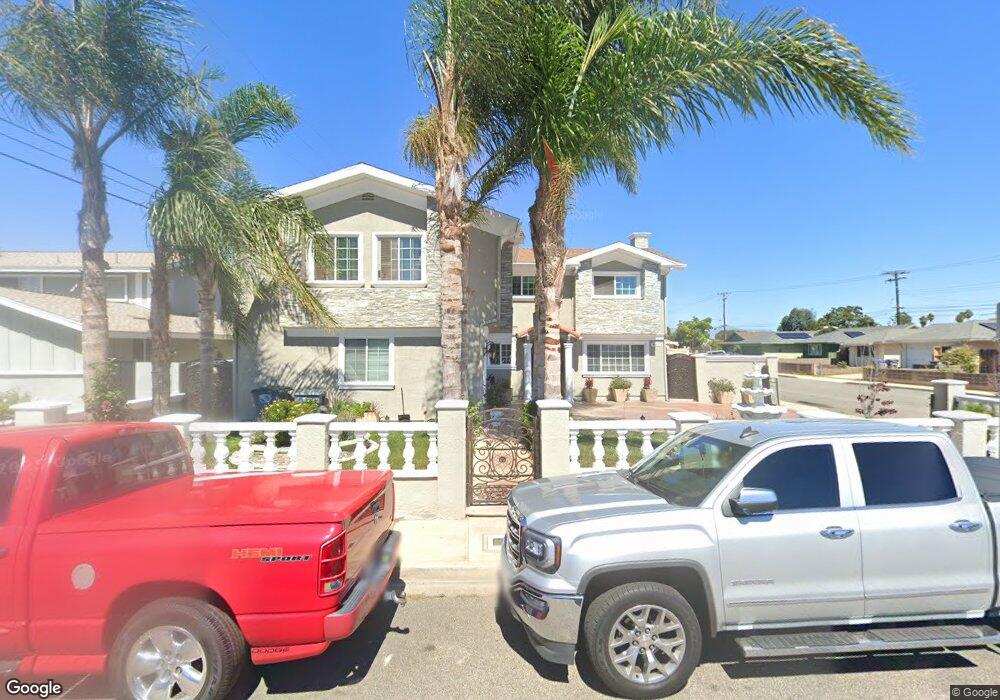
861 Trinidad Way Oxnard, CA 93033
Blackstock South NeighborhoodEstimated Value: $717,000 - $829,914
5
Beds
4
Baths
1,576
Sq Ft
$483/Sq Ft
Est. Value
About This Home
This home is located at 861 Trinidad Way, Oxnard, CA 93033 and is currently estimated at $761,479, approximately $483 per square foot. 861 Trinidad Way is a home located in Ventura County with nearby schools including Fred L. Williams Elementary School, Channel Islands High School, and Santa Clara High School.
Ownership History
Date
Name
Owned For
Owner Type
Purchase Details
Closed on
Sep 12, 2023
Sold by
Tapia Salvador G and Tapia Laura M
Bought by
Tapia Family Living Trust and Gutierrez
Current Estimated Value
Purchase Details
Closed on
Dec 26, 2000
Sold by
Brassfield Steven K and Brassfield Vickie L
Bought by
Tapia Salvador G and Tapia Laura M
Home Financials for this Owner
Home Financials are based on the most recent Mortgage that was taken out on this home.
Original Mortgage
$191,700
Interest Rate
7.41%
Purchase Details
Closed on
Aug 24, 1994
Sold by
Hanlon Morton A and Hanlon Cathy Ann
Bought by
Brassfield Steven K and Brassfield Vickie L
Home Financials for this Owner
Home Financials are based on the most recent Mortgage that was taken out on this home.
Original Mortgage
$173,400
Interest Rate
8.55%
Mortgage Type
Assumption
Create a Home Valuation Report for This Property
The Home Valuation Report is an in-depth analysis detailing your home's value as well as a comparison with similar homes in the area
Home Values in the Area
Average Home Value in this Area
Purchase History
| Date | Buyer | Sale Price | Title Company |
|---|---|---|---|
| Tapia Family Living Trust | -- | None Listed On Document | |
| Tapia Salvador G | $213,000 | American Title Co | |
| Brassfield Steven K | $170,000 | Commonwealth Land Title Co |
Source: Public Records
Mortgage History
| Date | Status | Borrower | Loan Amount |
|---|---|---|---|
| Previous Owner | Tapia Salvador G | $191,700 | |
| Previous Owner | Brassfield Steven K | $173,400 |
Source: Public Records
Tax History
| Year | Tax Paid | Tax Assessment Tax Assessment Total Assessment is a certain percentage of the fair market value that is determined by local assessors to be the total taxable value of land and additions on the property. | Land | Improvement |
|---|---|---|---|---|
| 2025 | $5,126 | $428,596 | $128,371 | $300,225 |
| 2024 | $5,126 | $420,193 | $125,854 | $294,339 |
| 2023 | $4,825 | $411,954 | $123,386 | $288,568 |
| 2022 | $4,726 | $403,877 | $120,967 | $282,910 |
| 2021 | $4,785 | $395,958 | $118,595 | $277,363 |
| 2020 | $4,872 | $391,900 | $117,380 | $274,520 |
| 2019 | $4,727 | $384,217 | $115,079 | $269,138 |
| 2018 | $4,553 | $376,684 | $112,823 | $263,861 |
| 2017 | $4,405 | $369,299 | $110,611 | $258,688 |
| 2016 | $3,983 | $343,506 | $108,443 | $235,063 |
| 2015 | $4,047 | $338,630 | $106,815 | $231,815 |
| 2014 | $3,756 | $313,562 | $104,721 | $208,841 |
Source: Public Records
Map
Nearby Homes
- 1036 Cheyenne Way
- 3130 Paula St
- 3151 Fournier St
- 360 Ibsen Place Unit 129
- 4160 Petit Dr Unit 39
- 3631 La Costa Place
- 4340 Highland Ave
- 320 Columbia Place Unit 46
- 4200 Browning Dr
- 140 Gaviota Place Unit 157
- 3638 S B St
- 4200 S A St
- 1928 San Benito St
- 4029 S B St
- 5117 Jefferson Square
- 2117 Cardinal Ave Unit 2117h
- 3700 Olds Rd Unit 86
- 5222 Longfellow Way
- 2178 Thrush Ave Unit J
- 2177 Robin Ave Unit 2177A
- 851 Trinidad Way
- 850 La Canada Ave
- 845 Trinidad Way
- 840 La Canada Ave
- 3530 San Simeon Ave
- 3520 San Simeon Ave
- 3540 San Simeon Ave
- 860 Trinidad Way
- 830 La Canada Ave
- 850 Trinidad Way
- 835 Trinidad Way
- 3550 San Simeon Ave
- 3510 San Simeon Ave
- 840 Trinidad Way
- 820 La Canada Ave
- 3560 San Simeon Ave
- 825 Trinidad Way
- 830 Trinidad Way
- 3500 San Simeon Ave
- 861 Morro Way
Your Personal Tour Guide
Ask me questions while you tour the home.