Estimated Value: $267,027 - $278,000
3
Beds
1
Bath
1,032
Sq Ft
$264/Sq Ft
Est. Value
About This Home
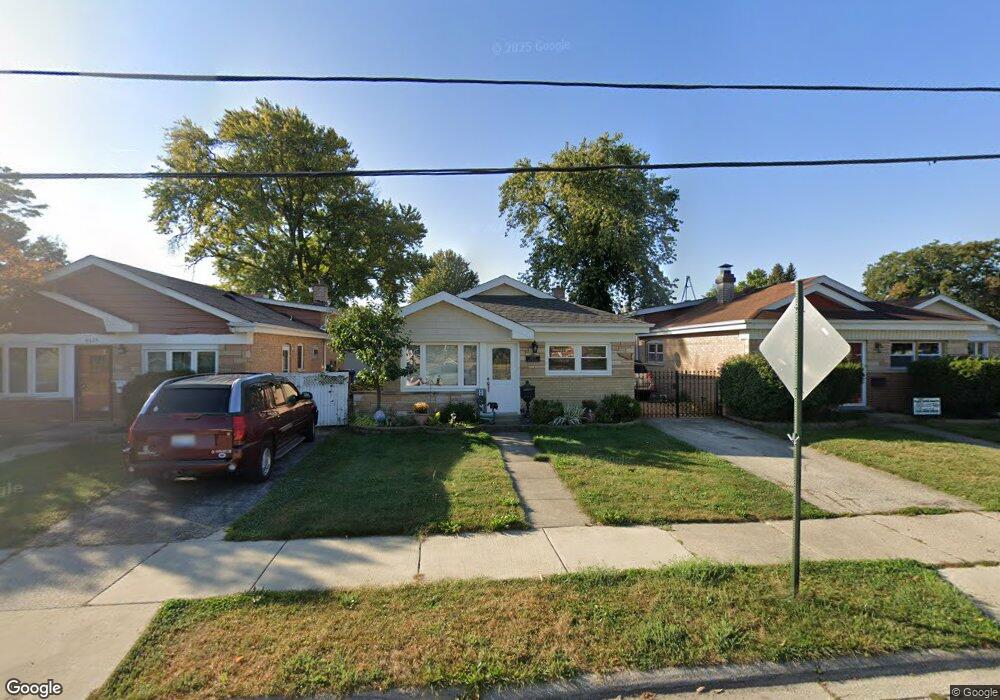
This home is located at 8627 43rd St, Lyons, IL 60534 and is currently estimated at $272,757, approximately $264 per square foot. 8627 43rd St is a home located in Cook County with nearby schools including Lincoln Elementary School, George Washington Middle School, and J. Sterling Morton High School West.
Ownership History
Date
Name
Owned For
Owner Type
Purchase Details
Closed on
Sep 2, 2004
Sold by
Kolar David
Bought by
Kolar David and Kolar Brigita
Current Estimated Value
Purchase Details
Closed on
Feb 23, 2004
Sold by
Goode David W and Goode Penny G
Bought by
Kolar David
Home Financials for this Owner
Home Financials are based on the most recent Mortgage that was taken out on this home.
Original Mortgage
$159,300
Outstanding Balance
$72,361
Interest Rate
5.71%
Mortgage Type
Unknown
Estimated Equity
$200,396
Purchase Details
Closed on
Dec 17, 1999
Sold by
Lucas Deborah J and Lucas David A
Bought by
Goode David W and Goode Penny G
Home Financials for this Owner
Home Financials are based on the most recent Mortgage that was taken out on this home.
Original Mortgage
$128,937
Interest Rate
7.87%
Mortgage Type
FHA
Create a Home Valuation Report for This Property
The Home Valuation Report is an in-depth analysis detailing your home's value as well as a comparison with similar homes in the area
Home Values in the Area
Average Home Value in this Area
Purchase History
| Date | Buyer | Sale Price | Title Company |
|---|---|---|---|
| Kolar David | -- | -- | |
| Kolar David | $177,000 | Pntn | |
| Goode David W | $130,000 | -- |
Source: Public Records
Mortgage History
| Date | Status | Borrower | Loan Amount |
|---|---|---|---|
| Open | Kolar David | $159,300 | |
| Previous Owner | Goode David W | $128,937 |
Source: Public Records
Tax History
| Year | Tax Paid | Tax Assessment Tax Assessment Total Assessment is a certain percentage of the fair market value that is determined by local assessors to be the total taxable value of land and additions on the property. | Land | Improvement |
|---|---|---|---|---|
| 2025 | $5,349 | $21,000 | $3,105 | $17,895 |
| 2024 | $5,349 | $21,000 | $3,105 | $17,895 |
| 2023 | $3,977 | $21,000 | $3,105 | $17,895 |
| 2022 | $3,977 | $14,368 | $2,700 | $11,668 |
| 2021 | $3,801 | $14,368 | $2,700 | $11,668 |
| 2020 | $3,898 | $14,368 | $2,700 | $11,668 |
| 2019 | $3,847 | $13,421 | $2,430 | $10,991 |
| 2018 | $3,759 | $13,421 | $2,430 | $10,991 |
| 2017 | $4,236 | $15,065 | $2,430 | $12,635 |
| 2016 | $3,693 | $11,985 | $2,160 | $9,825 |
| 2015 | $3,564 | $11,985 | $2,160 | $9,825 |
| 2014 | $4,870 | $15,821 | $2,160 | $13,661 |
| 2013 | $4,514 | $15,886 | $2,160 | $13,726 |
Source: Public Records
Map
Nearby Homes
- 8625 43rd St
- 8667 Plainfield Rd
- 4243 Konrad Ave
- 4218 Konrad Ave
- 4247 Anna Ave
- 8651 44th St
- 4249 Custer Ave
- 4053 Rose Ave
- 4040 Rose Ave
- 8803 Ogden Ave
- 8821 Congress Park Ave
- 4524 1st Ave
- 8332 44th Place
- 8636 40th St
- 8324 44th Place
- 8834 Plainfield Rd
- 8245 43rd Place
- 8244 44th St
- 4627 Custer Ave
- 3845 Mccormick Ave
- 8629 43rd St
- 8623 43rd St
- 8635 Plainfield Rd
- 8632 Lincoln Dr
- 8628 Lincoln Dr
- 8624 Lincoln Dr
- 8640 Lincoln Dr
- 8620 Lincoln Dr
- 8644 Lincoln Dr
- 4254 Rose Ave
- 8641 Plainfield Rd
- 8646 Lincoln Dr
- 8643 43rd St
- 4250 Rose Ave
- 8627 Plainfield Rd
- 8627 Plainfield Rd Unit 2
- 8643 Plainfield Rd
- 4230 Rose Ave
- 8647 43rd St
- 4247 Konrad Ave
Your Personal Tour Guide
Ask me questions while you tour the home.