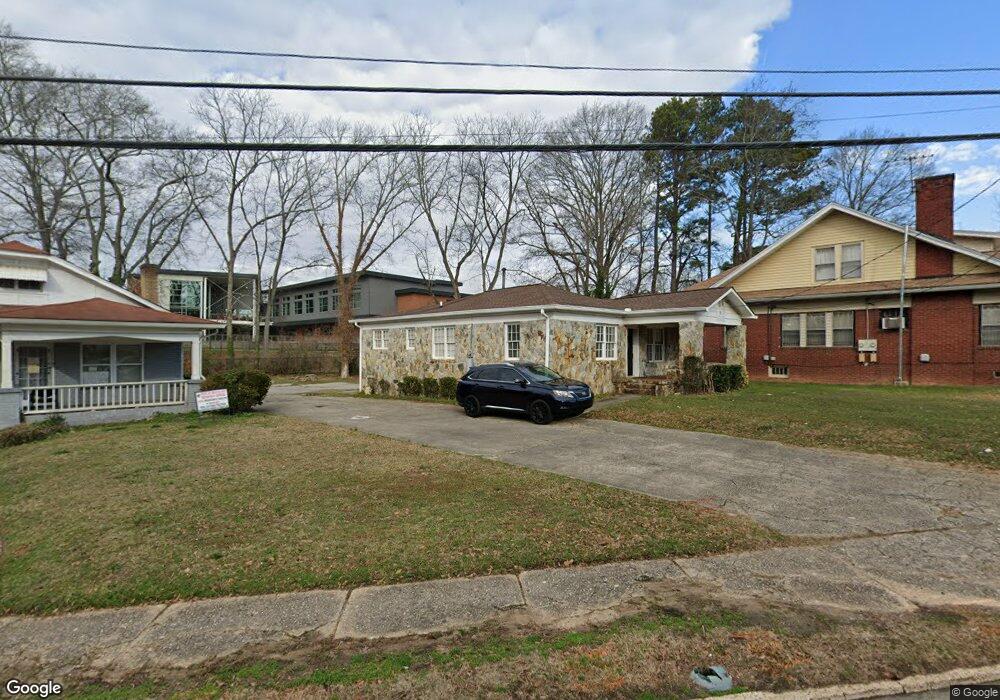
863 Cascade Rd SW Atlanta, GA 30311
Cascade Avenue NeighborhoodEstimated Value: $230,000 - $341,000
3
Beds
1
Bath
1,333
Sq Ft
$205/Sq Ft
Est. Value
About This Home
This home is located at 863 Cascade Rd SW, Atlanta, GA 30311 and is currently estimated at $273,148, approximately $204 per square foot. 863 Cascade Rd SW is a home located in Fulton County with nearby schools including Tuskegee Airman Global Academy, Herman J. Russell West End Academy, and Booker T. Washington High School.
Ownership History
Date
Name
Owned For
Owner Type
Purchase Details
Closed on
Mar 17, 2018
Sold by
Hornsby Kristie D
Bought by
The Hornsby Battle Rev Liv Tr
Current Estimated Value
Home Financials for this Owner
Home Financials are based on the most recent Mortgage that was taken out on this home.
Original Mortgage
$146,301
Outstanding Balance
$125,546
Interest Rate
4.44%
Estimated Equity
$147,602
Purchase Details
Closed on
Mar 15, 2018
Sold by
Angelin Houston
Bought by
Hornsby Kristie
Home Financials for this Owner
Home Financials are based on the most recent Mortgage that was taken out on this home.
Original Mortgage
$146,301
Outstanding Balance
$125,546
Interest Rate
4.44%
Estimated Equity
$147,602
Purchase Details
Closed on
Jan 11, 2017
Sold by
Ronchezz Gresham
Bought by
Houston Angeline
Purchase Details
Closed on
Jan 5, 2017
Sold by
Vanessa Estate
Bought by
Gresham Ronchezz
Purchase Details
Closed on
Jan 14, 2014
Sold by
Dozier Pamela
Bought by
Gresham Vanessa and Houston Anglin D
Create a Home Valuation Report for This Property
The Home Valuation Report is an in-depth analysis detailing your home's value as well as a comparison with similar homes in the area
Home Values in the Area
Average Home Value in this Area
Purchase History
| Date | Buyer | Sale Price | Title Company |
|---|---|---|---|
| The Hornsby Battle Rev Liv Tr | -- | -- | |
| Hornsby Kristie | $149,000 | -- | |
| Houston Angeline | -- | -- | |
| Gresham Ronchezz | -- | -- | |
| Gresham Vanessa | -- | -- |
Source: Public Records
Mortgage History
| Date | Status | Borrower | Loan Amount |
|---|---|---|---|
| Open | Hornsby Kristie | $146,301 | |
| Closed | Hornsby Kristie | -- |
Source: Public Records
Tax History Compared to Growth
Tax History
| Year | Tax Paid | Tax Assessment Tax Assessment Total Assessment is a certain percentage of the fair market value that is determined by local assessors to be the total taxable value of land and additions on the property. | Land | Improvement |
|---|---|---|---|---|
| 2025 | $2,733 | $85,680 | $40,800 | $44,880 |
| 2023 | $3,547 | $85,680 | $40,800 | $44,880 |
| 2022 | $3,467 | $85,680 | $40,800 | $44,880 |
| 2021 | $1,855 | $45,800 | $17,960 | $27,840 |
| 2020 | $1,784 | $43,560 | $19,760 | $23,800 |
| 2019 | $488 | $30,720 | $20,160 | $10,560 |
| 2018 | $1,187 | $28,680 | $14,120 | $14,560 |
| 2017 | $460 | $10,640 | $3,440 | $7,200 |
| 2016 | $461 | $10,640 | $3,440 | $7,200 |
| 2015 | $943 | $10,640 | $3,440 | $7,200 |
| 2014 | $482 | $10,640 | $3,440 | $7,200 |
Source: Public Records
Map
Nearby Homes
- 880 Cascade Rd SW
- 1554 Richland Rd SW
- 1546 Richland Rd SW
- 1576 Beecher St SW
- 1570 Beecher St SW
- 1587 Pineview Terrace SW
- 1622 Beecher St SW
- 880 Westmont Rd SW
- 1536 Montreat Ave SW
- 853 Gaston St SW
- 883 Gaston St SW
- 905 Gaston St SW
- 826 Gaston St SW
- 1679 Altadena Place SW
- 1658 Altadena Place SW
- 1649 Beecher St SW
- 870 Gaston St SW
- 1688 Richland Rd SW
- 863 Cascade Ave SW
- 867 Cascade Rd SW
- 855 Cascade Rd SW
- 775 Alvarado Terrace SW
- 847 Cascade Rd SW
- 874 Cascade Rd SW
- 868 Cascade Rd SW
- 888 Cascade Rd SW
- 890 Cascade Rd SW
- 890 Cascade Rd SW
- 1543 Richland Rd SW
- 1542 Richland Rd SW
- 891 Cascade Rd SW
- 891 Cascade Ave SW
- 1589 Westhaven Dr SW
- 896 Cascade Rd SW
- 1537 Richland Rd SW
- 1579 Montreat Ave SW
- 1538 Richland Rd SW
- 1579 Montreat Place SW