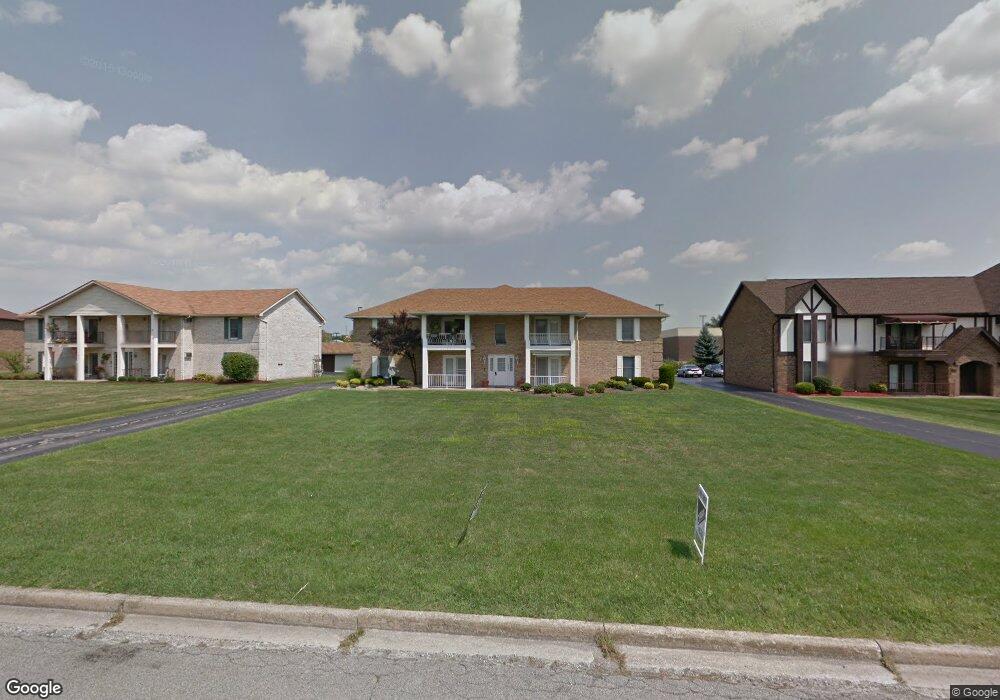
864 Pearson Cir Unit 2 Youngstown, OH 44512
Estimated Value: $105,000 - $115,022
2
Beds
1
Bath
1,006
Sq Ft
$109/Sq Ft
Est. Value
About This Home
This home is located at 864 Pearson Cir Unit 2, Youngstown, OH 44512 and is currently estimated at $109,506, approximately $108 per square foot. 864 Pearson Cir Unit 2 is a home located in Mahoning County with nearby schools including Robinwood Lane Elementary School, Boardman Glenwood Junior High School, and Boardman High School.
Ownership History
Date
Name
Owned For
Owner Type
Purchase Details
Closed on
Mar 24, 2023
Bought by
James R Spickler
Current Estimated Value
Purchase Details
Closed on
Dec 18, 2010
Sold by
Shovlin Tamra L
Bought by
Spickler James R
Home Financials for this Owner
Home Financials are based on the most recent Mortgage that was taken out on this home.
Original Mortgage
$50,200
Interest Rate
4.16%
Mortgage Type
New Conventional
Purchase Details
Closed on
Jun 20, 2005
Sold by
Jones Brian K and Jones Sandra K
Bought by
Spickler James R and Shovlin Tamra L
Home Financials for this Owner
Home Financials are based on the most recent Mortgage that was taken out on this home.
Original Mortgage
$50,925
Interest Rate
5.87%
Mortgage Type
Fannie Mae Freddie Mac
Purchase Details
Closed on
Jun 23, 1989
Bought by
Jones Sandra K
Create a Home Valuation Report for This Property
The Home Valuation Report is an in-depth analysis detailing your home's value as well as a comparison with similar homes in the area
Home Values in the Area
Average Home Value in this Area
Purchase History
| Date | Buyer | Sale Price | Title Company |
|---|---|---|---|
| James R Spickler | -- | -- | |
| Spickler James R | -- | Attorney | |
| Spickler James R | $67,900 | -- | |
| Jones Sandra K | $51,000 | -- |
Source: Public Records
Mortgage History
| Date | Status | Borrower | Loan Amount |
|---|---|---|---|
| Previous Owner | Spickler James R | $50,200 | |
| Previous Owner | Spickler James R | $50,925 | |
| Closed | Spickler James R | $16,975 |
Source: Public Records
Tax History
| Year | Tax Paid | Tax Assessment Tax Assessment Total Assessment is a certain percentage of the fair market value that is determined by local assessors to be the total taxable value of land and additions on the property. | Land | Improvement |
|---|---|---|---|---|
| 2025 | $1,403 | $27,930 | $2,450 | $25,480 |
| 2024 | $1,435 | $27,930 | $2,450 | $25,480 |
| 2023 | $1,416 | $27,930 | $2,450 | $25,480 |
| 2022 | $1,225 | $18,400 | $2,000 | $16,400 |
| 2021 | $1,225 | $18,400 | $2,000 | $16,400 |
| 2020 | $1,232 | $18,400 | $2,000 | $16,400 |
| 2019 | $1,232 | $16,140 | $1,750 | $14,390 |
| 2018 | $1,053 | $16,140 | $1,750 | $14,390 |
| 2017 | $1,037 | $16,140 | $1,750 | $14,390 |
| 2016 | $1,163 | $17,960 | $2,630 | $15,330 |
| 2015 | $1,140 | $17,960 | $2,630 | $15,330 |
| 2014 | $1,143 | $17,960 | $2,630 | $15,330 |
| 2013 | $1,129 | $17,960 | $2,630 | $15,330 |
Source: Public Records
Map
Nearby Homes
- 852 Pearson Cir Unit 3
- 876 Pearson Cir Unit 2
- 901 Pearson Cir Unit 3
- 7357 Eisenhower Dr Unit 6
- 8360 South Ave
- 7362 Eisenhower Dr Unit 5
- 675 Presidential Dr
- 7708 Buchanan Dr
- 681 Saddlebrook Dr
- 6278 Appleridge Dr
- 1860 Massachusetts Ave Unit 2
- 6785 Tanglewood Dr
- 148 Island Dr
- 125 Island Dr
- 839 Edenridge Dr
- 889 Edenridge Dr
- 732 Forest Ridge Dr
- 888 Edenridge Dr
- 1851 Alverne Dr
- 7900 Walnut St Unit 25
- 864 Pearson Cir Unit 4
- 864 Pearson Cir Unit 3
- 864 Pearson Cir Unit 1
- 858 Pearson Cir Unit 4
- 858 Pearson Cir Unit 3
- 858 Pearson Cir Unit 2
- 858 Pearson Cir Unit 1
- 858 Pearson Cir
- 858 Pearson Cir Unit 11
- 870 Pearson Cir Unit 4
- 870 Pearson Cir Unit 3
- 870 Pearson Cir Unit 2
- 870 Pearson Cir Unit 1
- 852 Pearson Cir Unit 4
- 852 Pearson Cir Unit 2
- 852 Pearson Cir Unit 1
- 835 Pearson Cir Unit 4
- 835 Pearson Cir Unit 3
- 835 Pearson Cir Unit 2
- 835 Pearson Cir Unit 1
Your Personal Tour Guide
Ask me questions while you tour the home.