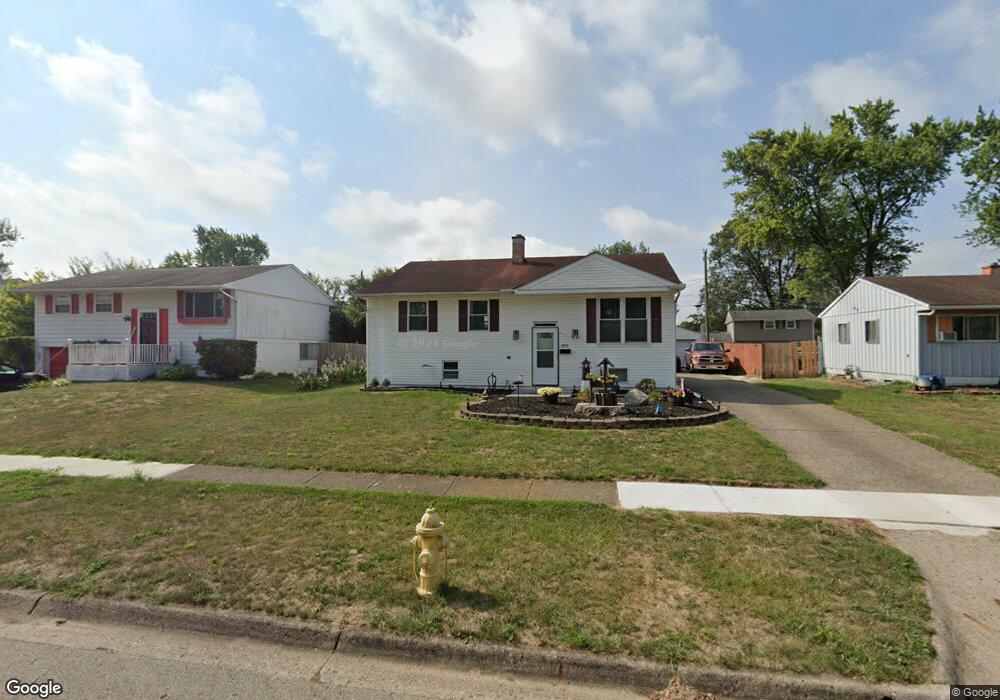
865 Alburn Dr Columbus, OH 43207
Obetz-Lockbourne NeighborhoodEstimated Value: $249,000 - $277,000
4
Beds
2
Baths
1,274
Sq Ft
$204/Sq Ft
Est. Value
About This Home
This home is located at 865 Alburn Dr, Columbus, OH 43207 and is currently estimated at $259,960, approximately $204 per square foot. 865 Alburn Dr is a home located in Franklin County with nearby schools including Hamilton Elementary School, Hamilton Intermediate School, and Hamilton Middle School.
Ownership History
Date
Name
Owned For
Owner Type
Purchase Details
Closed on
May 29, 2008
Sold by
Morse Barbara A
Bought by
Hines Marsha L and Hines Jack A
Current Estimated Value
Home Financials for this Owner
Home Financials are based on the most recent Mortgage that was taken out on this home.
Original Mortgage
$127,641
Outstanding Balance
$82,074
Interest Rate
6.09%
Mortgage Type
FHA
Estimated Equity
$177,886
Purchase Details
Closed on
Feb 24, 2003
Sold by
Clark Richard A and Clark Jackie
Bought by
Morse Barbara A
Home Financials for this Owner
Home Financials are based on the most recent Mortgage that was taken out on this home.
Original Mortgage
$117,950
Interest Rate
6%
Mortgage Type
FHA
Purchase Details
Closed on
May 31, 2002
Sold by
Newsome Kathy and Newsome Kathy
Bought by
Clark Richard A and Clark Michael R
Purchase Details
Closed on
Aug 6, 1984
Bought by
Newsome Kathy
Purchase Details
Closed on
Jul 1, 1979
Create a Home Valuation Report for This Property
The Home Valuation Report is an in-depth analysis detailing your home's value as well as a comparison with similar homes in the area
Home Values in the Area
Average Home Value in this Area
Purchase History
| Date | Buyer | Sale Price | Title Company |
|---|---|---|---|
| Hines Marsha L | $128,700 | Chicago Tit | |
| Morse Barbara A | $118,900 | Amerititle Mill Run | |
| Clark Richard A | $65,000 | -- | |
| Newsome Kathy | $52,000 | -- | |
| -- | $42,500 | -- |
Source: Public Records
Mortgage History
| Date | Status | Borrower | Loan Amount |
|---|---|---|---|
| Open | Hines Marsha L | $127,641 | |
| Closed | Morse Barbara A | $117,950 |
Source: Public Records
Tax History Compared to Growth
Tax History
| Year | Tax Paid | Tax Assessment Tax Assessment Total Assessment is a certain percentage of the fair market value that is determined by local assessors to be the total taxable value of land and additions on the property. | Land | Improvement |
|---|---|---|---|---|
| 2024 | $3,877 | $77,500 | $17,750 | $59,750 |
| 2023 | $3,859 | $77,490 | $17,745 | $59,745 |
| 2022 | $2,149 | $39,630 | $6,200 | $33,430 |
| 2021 | $2,178 | $39,630 | $6,200 | $33,430 |
| 2020 | $2,218 | $39,630 | $6,200 | $33,430 |
| 2019 | $2,085 | $33,010 | $5,150 | $27,860 |
| 2018 | $2,102 | $33,010 | $5,150 | $27,860 |
| 2017 | $2,115 | $33,010 | $5,150 | $27,860 |
| 2016 | $2,262 | $34,970 | $6,340 | $28,630 |
| 2015 | $2,145 | $34,970 | $6,340 | $28,630 |
| 2014 | $2,134 | $34,970 | $6,340 | $28,630 |
| 2013 | $1,142 | $38,850 | $7,035 | $31,815 |
Source: Public Records
Map
Nearby Homes
- 5140 Meadowbrook Dr
- 5083 Meadowbrook Dr
- 920 Cherrydale Ave
- 5340 Edgeview Rd
- 4917 Fishburn Ct
- 1059 Belford Ave
- 1031 Secrest Ave
- 5081 Lockbourne Rd
- 1091 Secrest Ave
- 1099 Secrest Ave
- 1291 Webb Dr Unit Lot 90
- 1292 Webb Dr Unit Lot 83
- 1315 Webb Dr Unit Lot 93
- 353 Kear St
- 481 Wellsleyglen Dr
- 4434 Butler Farms Dr
- 520 Wyndham Ridge Dr
- 4175 Holstein Dr
- 4241 Gelbray Ct
- 785 Scarlett Ln