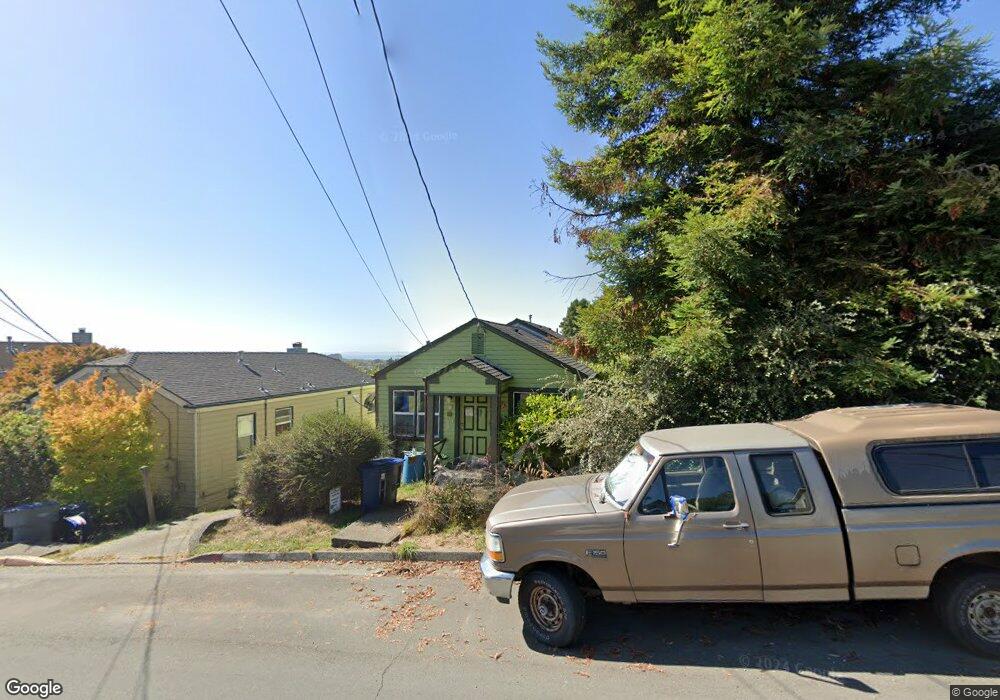
865 Union St Arcata, CA 95521
East Arcata-Bay View NeighborhoodEstimated Value: $448,000 - $851,000
Studio
--
Bath
--
Sq Ft
7,057
Sq Ft Lot
About This Home
This home is located at 865 Union St, Arcata, CA 95521 and is currently estimated at $592,808. 865 Union St is a home located in Humboldt County with nearby schools including Arcata Elementary School, Sunny Brae Middle School, and Arcata High School.
Ownership History
Date
Name
Owned For
Owner Type
Purchase Details
Closed on
May 29, 2020
Sold by
Michael Vogel And Lia Sullivan 2016 Trus
Bought by
Vogel Michael S and Sullivan Lia A
Current Estimated Value
Home Financials for this Owner
Home Financials are based on the most recent Mortgage that was taken out on this home.
Original Mortgage
$75,000
Outstanding Balance
$66,315
Interest Rate
3.3%
Mortgage Type
New Conventional
Estimated Equity
$526,493
Purchase Details
Closed on
Mar 22, 2016
Sold by
Sullivan Lia A and Vogel Michael S
Bought by
Michael Vogel & Lia Sullivan 2016 Trust
Purchase Details
Closed on
Dec 21, 2012
Sold by
Sullivan Lia A
Bought by
Vogel Michael S
Create a Home Valuation Report for This Property
The Home Valuation Report is an in-depth analysis detailing your home's value as well as a comparison with similar homes in the area
Home Values in the Area
Average Home Value in this Area
Purchase History
| Date | Buyer | Sale Price | Title Company |
|---|---|---|---|
| Vogel Michael S | -- | Timios Title | |
| Michael Vogel & Lia Sullivan 2016 Trust | -- | None Available | |
| Vogel Michael S | -- | None Available |
Source: Public Records
Mortgage History
| Date | Status | Borrower | Loan Amount |
|---|---|---|---|
| Open | Vogel Michael S | $75,000 |
Source: Public Records
Tax History
| Year | Tax Paid | Tax Assessment Tax Assessment Total Assessment is a certain percentage of the fair market value that is determined by local assessors to be the total taxable value of land and additions on the property. | Land | Improvement |
|---|---|---|---|---|
| 2025 | $2,228 | $186,904 | $104,006 | $82,898 |
| 2024 | $2,228 | $183,240 | $101,967 | $81,273 |
| 2023 | $2,184 | $179,648 | $99,968 | $79,680 |
| 2022 | $2,219 | $176,126 | $98,008 | $78,118 |
| 2021 | $2,119 | $172,674 | $96,087 | $76,587 |
| 2020 | $2,029 | $170,904 | $95,102 | $75,802 |
| 2019 | $1,965 | $167,554 | $93,238 | $74,316 |
| 2018 | $1,920 | $164,269 | $91,410 | $72,859 |
| 2017 | $1,878 | $161,049 | $89,618 | $71,431 |
| 2016 | $1,809 | $157,892 | $87,861 | $70,031 |
| 2015 | $1,789 | $155,522 | $86,542 | $68,980 |
| 2014 | $1,790 | $152,476 | $84,847 | $67,629 |
Source: Public Records
Map
Nearby Homes
- 632 9th St
- 753 Shirley Blvd
- 836 12th and 1192 I St
- 16 & 46 G St
- 119 Sylva St
- 113 Sylva St
- 330 California Ave
- 1205 Old Arcata Rd
- 1131 Austin Way
- 1836 Blakeslee Ave
- 1096 Diamond Dr
- 2700 Meadow Creek Way
- 1666 Stewart Ave
- 1346 Diamond Dr
- 812 Diamond Dr
- 3122 St Louis Rd
- 1254 Mccallum Cir
- 3028 Alliance Rd
- 3030 Alliance Rd
- 2099 Fickle Hill Rd
Your Personal Tour Guide
Ask me questions while you tour the home.