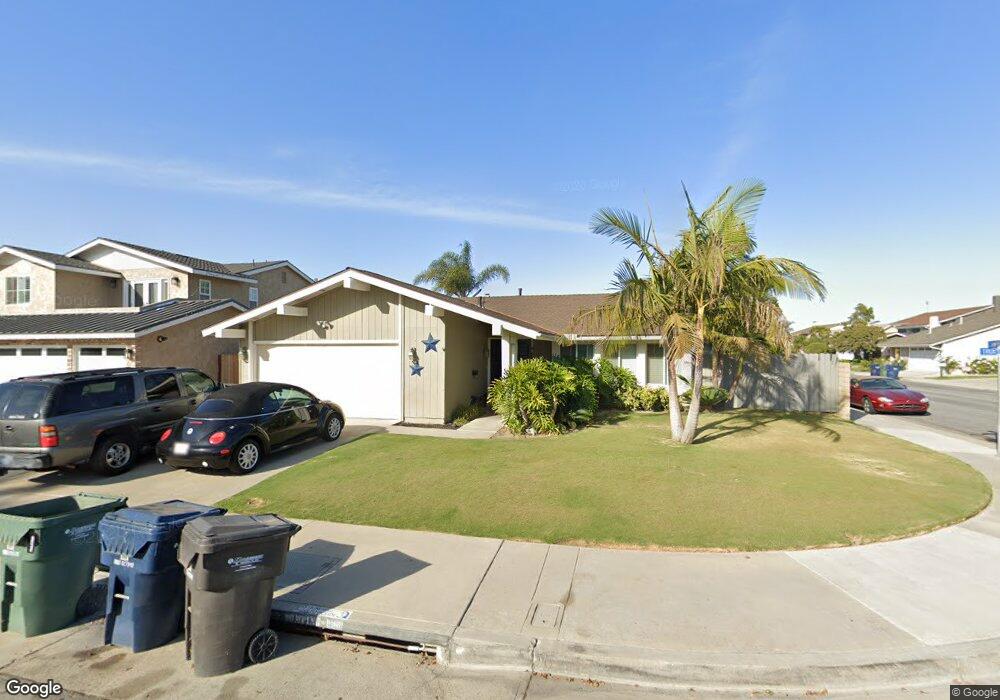
8651 Truxton Dr Huntington Beach, CA 92646
Southeast NeighborhoodEstimated Value: $1,335,956 - $1,549,000
4
Beds
2
Baths
1,540
Sq Ft
$950/Sq Ft
Est. Value
About This Home
This home is located at 8651 Truxton Dr, Huntington Beach, CA 92646 and is currently estimated at $1,463,489, approximately $950 per square foot. 8651 Truxton Dr is a home located in Orange County with nearby schools including S.A. Moffett Elementary School, Isaac L. Sowers Middle School, and Edison High School.
Ownership History
Date
Name
Owned For
Owner Type
Purchase Details
Closed on
Feb 16, 2011
Sold by
Rademaker Michael A
Bought by
Rademaker Tracy R
Current Estimated Value
Purchase Details
Closed on
Feb 28, 2005
Sold by
Rademaker Michael A and Rademaker Tracy R
Bought by
Rademaker Michael A and Rademaker Tracy R
Purchase Details
Closed on
Sep 30, 1999
Sold by
Security Trust Company
Bought by
Rademaker Dolores and Rademaker Michael A
Purchase Details
Closed on
Apr 23, 1996
Sold by
Rademaker Dolores and Rademaker Michael A
Bought by
Rademaker Dolores and Rademaker Michael A
Home Financials for this Owner
Home Financials are based on the most recent Mortgage that was taken out on this home.
Original Mortgage
$57,500
Interest Rate
7.84%
Create a Home Valuation Report for This Property
The Home Valuation Report is an in-depth analysis detailing your home's value as well as a comparison with similar homes in the area
Home Values in the Area
Average Home Value in this Area
Purchase History
| Date | Buyer | Sale Price | Title Company |
|---|---|---|---|
| Rademaker Tracy R | -- | None Available | |
| Rademaker Michael A | -- | -- | |
| Rademaker Dolores | -- | Chicago Title Co | |
| Rademaker Dolores | -- | California Counties Title Co |
Source: Public Records
Mortgage History
| Date | Status | Borrower | Loan Amount |
|---|---|---|---|
| Previous Owner | Rademaker Dolores | $57,500 |
Source: Public Records
Tax History Compared to Growth
Tax History
| Year | Tax Paid | Tax Assessment Tax Assessment Total Assessment is a certain percentage of the fair market value that is determined by local assessors to be the total taxable value of land and additions on the property. | Land | Improvement |
|---|---|---|---|---|
| 2025 | $3,371 | $275,598 | $154,426 | $121,172 |
| 2024 | $3,371 | $270,195 | $151,398 | $118,797 |
| 2023 | $3,293 | $264,898 | $148,430 | $116,468 |
| 2022 | $3,206 | $259,704 | $145,519 | $114,185 |
| 2021 | $3,148 | $254,612 | $142,665 | $111,947 |
| 2020 | $3,127 | $252,002 | $141,202 | $110,800 |
| 2019 | $3,092 | $247,061 | $138,433 | $108,628 |
| 2018 | $3,045 | $242,217 | $135,718 | $106,499 |
| 2017 | $3,005 | $237,468 | $133,057 | $104,411 |
| 2016 | $2,879 | $232,812 | $130,448 | $102,364 |
| 2015 | $2,850 | $229,315 | $128,488 | $100,827 |
| 2014 | $2,791 | $224,824 | $125,972 | $98,852 |
Source: Public Records
Map
Nearby Homes
- 20191 Imperial Cove Ln
- 8565 Trinity Cir Unit 824D
- 20251 Lighthouse Ln
- 20131 Crown Reef Ln
- 8886 Plumas Cir Unit 1124-A
- 8472 Norfolk Dr
- 8565 Colusa Cir Unit 906C
- 8646 Butte Cir Unit 607E
- 8342 Seaport Dr
- 8856 Sutter Cir Unit 522A
- 8856 526C Sutter
- 8565 Larkhall Cir Unit 804A
- 8566 Larkhall Cir Unit 808A
- 8566 Larkhall Cir Unit 809D
- 8932 Amador Cir Unit 1309B
- 8777 Tulare Dr Unit 409D
- 20162 S New Britain Ln
- 20258 Lantana Dr
- 20302 Tidepool Cir Unit 204
- 20401 Somerville Ln
- 8641 Truxton Dr
- 8652 Marvale Dr
- 8642 Marvale Dr
- 8631 Truxton Dr
- 20372 Camfield Ln
- 20391 Camfield Ln
- 20362 Camfield Ln
- 20382 Camfield Ln
- 8632 Marvale Dr
- 20352 Camfield Ln
- 8621 Truxton Dr
- 20392 Drew Cir
- 20392 Camfield Ln
- 20401 Camfield Ln
- 8622 Marvale Dr
- 20342 Camfield Ln
- 20402 Drew Cir
- 20371 Meander Ln
- 20402 Camfield Ln
- 8611 Truxton Dr