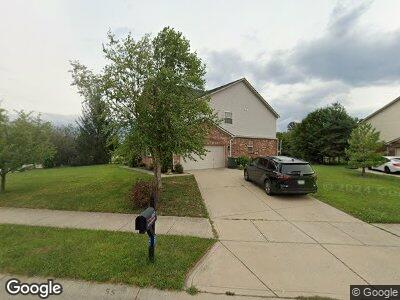
8653 N Springview Dr Mc Cordsville, IN 46055
Brooks-Luxhaven NeighborhoodEstimated Value: $425,749 - $481,000
5
Beds
4
Baths
3,198
Sq Ft
$143/Sq Ft
Est. Value
About This Home
This home is located at 8653 N Springview Dr, Mc Cordsville, IN 46055 and is currently estimated at $457,437, approximately $143 per square foot. 8653 N Springview Dr is a home located in Hancock County with nearby schools including Mccordsville Elementary School, Mt. Vernon Middle School, and Mt. Vernon High School.
Ownership History
Date
Name
Owned For
Owner Type
Purchase Details
Closed on
Jul 20, 2018
Sold by
Abbott Jeremiah
Bought by
Jones John M
Current Estimated Value
Home Financials for this Owner
Home Financials are based on the most recent Mortgage that was taken out on this home.
Original Mortgage
$256,500
Outstanding Balance
$224,600
Interest Rate
4.5%
Mortgage Type
New Conventional
Estimated Equity
$232,837
Purchase Details
Closed on
Oct 31, 2011
Sold by
Fannie Mae
Bought by
Abbott Jeremiah and Abbott Heather
Home Financials for this Owner
Home Financials are based on the most recent Mortgage that was taken out on this home.
Original Mortgage
$190,056
Interest Rate
4.25%
Mortgage Type
FHA
Purchase Details
Closed on
Apr 7, 2011
Sold by
Shine Carrie L
Bought by
Federal National Mortgage Association and Fannie Mae
Create a Home Valuation Report for This Property
The Home Valuation Report is an in-depth analysis detailing your home's value as well as a comparison with similar homes in the area
Home Values in the Area
Average Home Value in this Area
Purchase History
| Date | Buyer | Sale Price | Title Company |
|---|---|---|---|
| Jones John M | -- | First American Title | |
| Abbott Jeremiah | -- | None Avilebel | |
| Federal National Mortgage Association | $175,942 | -- |
Source: Public Records
Mortgage History
| Date | Status | Borrower | Loan Amount |
|---|---|---|---|
| Open | Jones John M | $256,500 | |
| Previous Owner | Abbott Jeremiah | $220,543 | |
| Previous Owner | Abbott Jeremiah | $190,056 | |
| Previous Owner | Shine Carrie L | $80,000 |
Source: Public Records
Tax History Compared to Growth
Tax History
| Year | Tax Paid | Tax Assessment Tax Assessment Total Assessment is a certain percentage of the fair market value that is determined by local assessors to be the total taxable value of land and additions on the property. | Land | Improvement |
|---|---|---|---|---|
| 2024 | $4,686 | $434,900 | $48,000 | $386,900 |
| 2023 | $4,686 | $428,500 | $48,000 | $380,500 |
| 2022 | $3,563 | $325,800 | $35,000 | $290,800 |
| 2021 | $2,770 | $277,000 | $35,000 | $242,000 |
| 2020 | $2,652 | $265,200 | $35,000 | $230,200 |
| 2019 | $2,572 | $257,200 | $35,000 | $222,200 |
| 2018 | $2,380 | $238,000 | $35,000 | $203,000 |
| 2017 | $2,292 | $229,200 | $36,300 | $192,900 |
| 2016 | $2,232 | $223,200 | $36,300 | $186,900 |
| 2014 | $2,112 | $201,700 | $35,200 | $166,500 |
| 2013 | $2,112 | $197,200 | $35,200 | $162,000 |
Source: Public Records
Map
Nearby Homes
- 7338 Broadview Ln
- 7308 Broadview Ln
- 7356 W County Road 600 Rd Unit 12-606
- 7348 W County Road 600 Rd Unit 12-604
- 5861 W Deerview Bend
- 8748 N Autumnview Dr
- 7340 W County Road 600 Rd
- 5778 W Commonview Dr
- 7352 W County Road 600 Rd
- 5824 W Commonview Dr
- 7370 Broadview Ln
- 8965 N 600 W
- 5308 W Glenview Dr
- 5457 W 900 N
- 5332 W Glenview Dr
- 8893 Alexander Ridge Dr
- 8912 Alexander Ridge Dr
- 8931 Alexander Ridge Dr
- 6204 Fairview Dr
- 6222 Fairview Dr
- 8653 N Springview Dr
- 8631 N Springview Dr
- 8662 N Springview Dr
- 8930 W Woodview Trail
- 8640 N Springview Dr
- 5743 W Woodview Trail
- 8672 N Springview Dr
- 5752 W Woodview Trail
- 8628 N Springview Dr
- 8684 N Springview Dr
- 8611 N Springview Dr
- 5736 W Woodview Trail
- 8608 N Springview Dr
- 8599 N Springview Dr
- 5722 W Woodview Trail
- 8696 N Springview Dr
- 5739 W Crestview Trail
- 5707 W Woodview Trail
- 7344 County Road 600 W
- 7348 W County Road 600 Rd