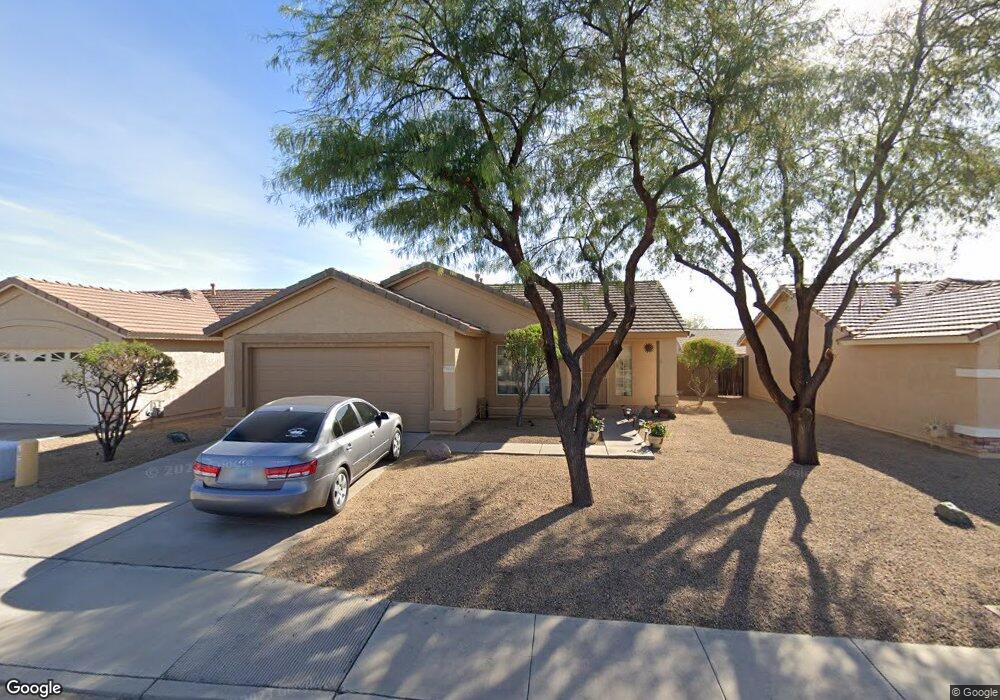
8655 E Calypso Ave Mesa, AZ 85208
Fountain of the Sun NeighborhoodEstimated Value: $316,601 - $388,000
Studio
2
Baths
1,145
Sq Ft
$316/Sq Ft
Est. Value
About This Home
This home is located at 8655 E Calypso Ave, Mesa, AZ 85208 and is currently estimated at $361,400, approximately $315 per square foot. 8655 E Calypso Ave is a home located in Maricopa County with nearby schools including Stevenson Elementary School, Franklin at Brimhall Elementary School, and Franklin West Elementary School.
Ownership History
Date
Name
Owned For
Owner Type
Purchase Details
Closed on
Apr 21, 2015
Sold by
Shelabarger Johne M
Bought by
Shelabarger Johne Mae and The Johne Mae Shelabarger Living Trust
Current Estimated Value
Purchase Details
Closed on
Sep 27, 1997
Sold by
Beazer Homes Sales Arizona Inc
Bought by
Imhoff Mark D
Home Financials for this Owner
Home Financials are based on the most recent Mortgage that was taken out on this home.
Original Mortgage
$90,050
Outstanding Balance
$14,582
Interest Rate
7.54%
Mortgage Type
New Conventional
Estimated Equity
$346,818
Purchase Details
Closed on
Jul 1, 1996
Sold by
Beazer Home Sales Arizona Inc
Bought by
Shelabarger Richard L and Shelabarger Johne M
Home Financials for this Owner
Home Financials are based on the most recent Mortgage that was taken out on this home.
Original Mortgage
$85,374
Interest Rate
8.09%
Mortgage Type
VA
Create a Home Valuation Report for This Property
The Home Valuation Report is an in-depth analysis detailing your home's value as well as a comparison with similar homes in the area
Home Values in the Area
Average Home Value in this Area
Purchase History
| Date | Buyer | Sale Price | Title Company |
|---|---|---|---|
| Shelabarger Johne Mae | -- | None Available | |
| Imhoff Mark D | $100,088 | Lawyers Title Of Arizona Inc | |
| Beazer Homes Sales Arizona Inc | -- | Lawyers Title Of Arizona Inc | |
| Shelabarger Richard L | $83,716 | United Title Agency | |
| Beazer Homes Sales Arizona Inc | -- | United Title Agency |
Source: Public Records
Mortgage History
| Date | Status | Borrower | Loan Amount |
|---|---|---|---|
| Open | Imhoff Mark D | $90,050 | |
| Previous Owner | Shelabarger Richard L | $85,374 |
Source: Public Records
Tax History
| Year | Tax Paid | Tax Assessment Tax Assessment Total Assessment is a certain percentage of the fair market value that is determined by local assessors to be the total taxable value of land and additions on the property. | Land | Improvement |
|---|---|---|---|---|
| 2025 | $664 | $12,737 | -- | -- |
| 2024 | $665 | $12,130 | -- | -- |
| 2023 | $665 | $26,170 | $5,230 | $20,940 |
| 2022 | $648 | $20,220 | $4,040 | $16,180 |
| 2021 | $653 | $18,500 | $3,700 | $14,800 |
| 2020 | $631 | $16,900 | $3,380 | $13,520 |
| 2019 | $573 | $15,280 | $3,050 | $12,230 |
| 2018 | $535 | $13,510 | $2,700 | $10,810 |
| 2017 | $505 | $11,680 | $2,330 | $9,350 |
| 2016 | $479 | $10,420 | $2,080 | $8,340 |
| 2015 | $442 | $10,070 | $2,010 | $8,060 |
Source: Public Records
Map
Nearby Homes
- 8658 E Capri Ave
- 8600 E Broadway Rd Unit 151
- 8600 E Broadway Rd Unit 13
- 8600 E Broadway Rd Unit 109
- 8600 E Broadway Rd Unit 55
- 451 S Hawes Rd Unit 32
- 451 S Hawes Rd Unit 19
- 8502 E Carol Ave
- 627 S 87th Way
- 331 S 84th Way Unit 76
- 218 S Glenmar Rd
- 8919 E Calypso Ave
- 8927 E Carlton Ave
- 8615 E Main St Unit B37
- 244 S 89th St
- 147 S 84th Way
- 525 S 89th Way
- 731 S 85th St
- 512 S 83rd Way
- 321 S 89th Place
- 8649 E Calypso Ave
- 8663 E Calypso Ave
- 8656 E Crescent Ave
- 8645 E Calypso Ave
- 8664 E Crescent Ave
- 8650 E Crescent Ave
- 8646 E Crescent Ave
- 8654 E Calypso Ave
- 8662 E Calypso Ave
- 8648 E Calypso Ave
- 8639 E Calypso Ave
- 435 S 87th St
- 8644 E Calypso Ave
- 8640 E Crescent Ave
- 8704 E Calypso Ave
- 429 S 87th St
- 8751 E Broadway Rd
- 8635 E Calypso Ave
- 8638 E Calypso Ave
- 421 S 87th St
Your Personal Tour Guide
Ask me questions while you tour the home.