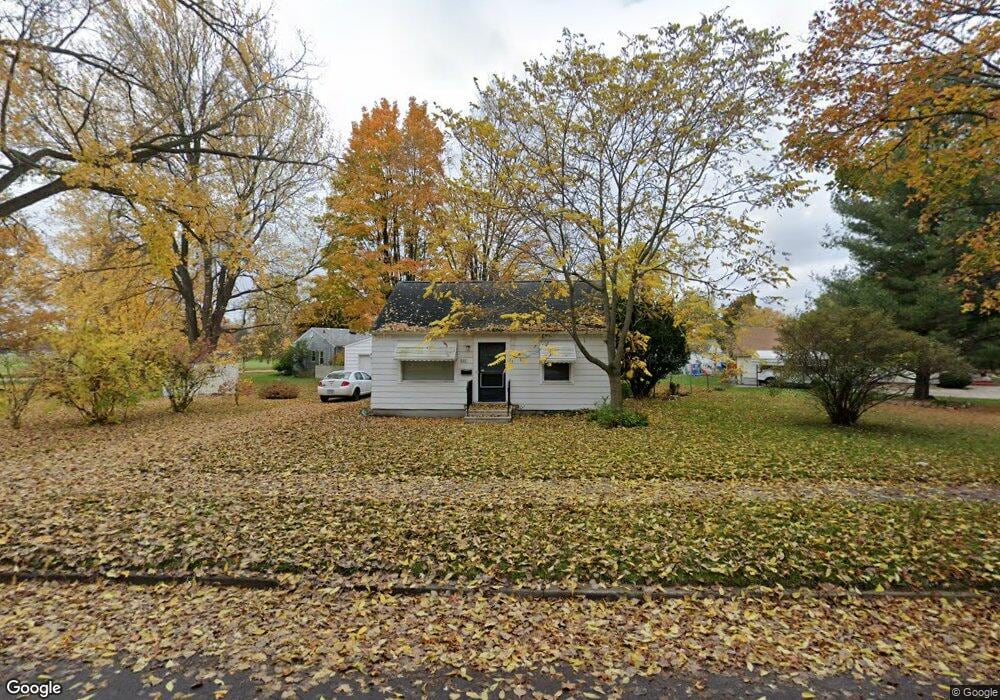
866 Hunter Blvd Lansing, MI 48910
Old Everett NeighborhoodEstimated Value: $97,000 - $107,000
2
Beds
1
Bath
672
Sq Ft
$151/Sq Ft
Est. Value
About This Home
This home is located at 866 Hunter Blvd, Lansing, MI 48910 and is currently estimated at $101,635, approximately $151 per square foot. 866 Hunter Blvd is a home located in Ingham County with nearby schools including Kendon School, Attwood School, and Everett High School.
Ownership History
Date
Name
Owned For
Owner Type
Purchase Details
Closed on
Mar 15, 2018
Sold by
Torch Way Properties Llc
Bought by
Fox Land Holdings Llc
Current Estimated Value
Purchase Details
Closed on
Feb 11, 2009
Sold by
Trott & Trott Pc
Bought by
Torch Way Properties Llc
Purchase Details
Closed on
Oct 10, 2008
Sold by
Citimortgage Inc
Bought by
Federal National Mortgage Association
Purchase Details
Closed on
Oct 9, 2008
Sold by
Stenzel Joseph L
Bought by
Citimortgage Inc
Purchase Details
Closed on
Mar 30, 2007
Sold by
Mcmichael Rodney L
Bought by
Stenzel Joseph L
Home Financials for this Owner
Home Financials are based on the most recent Mortgage that was taken out on this home.
Original Mortgage
$72,150
Interest Rate
6.19%
Mortgage Type
Purchase Money Mortgage
Purchase Details
Closed on
Sep 20, 2004
Sold by
Mayhew Dawn M and Mcmichael Dawn M
Bought by
Mcmichael Rodney L
Purchase Details
Closed on
Jun 27, 2001
Sold by
Lloyd Frank W and Lloyd Beverley J
Bought by
Mcmichael Rodney and Mcmichael Dawn
Purchase Details
Closed on
Jan 25, 2001
Sold by
Woodrel Albert
Bought by
Lloyd Frank W and Lloyd Beverly J
Create a Home Valuation Report for This Property
The Home Valuation Report is an in-depth analysis detailing your home's value as well as a comparison with similar homes in the area
Home Values in the Area
Average Home Value in this Area
Purchase History
We collect this data history from publicly available records. To have your information removed, we recommend requesting removal directly through your county’s website.
| Date | Buyer | Sale Price | Title Company |
|---|---|---|---|
| Fox Land Holdings Llc | -- | Bribge Title Agency Llc | |
| Torch Way Properties Llc | $22,000 | Warranty Title | |
| Federal National Mortgage Association | -- | None Available | |
| Citimortgage Inc | $76,022 | None Available | |
| Stenzel Joseph L | $72,150 | None Available | |
| Mcmichael Rodney L | -- | None Available | |
| Mcmichael Rodney | $69,500 | -- | |
| Lloyd Frank W | $46,000 | -- |
Source: Public Records
Mortgage History
We collect this data history from publicly available records. To have your information removed, we recommend requesting removal directly through your county’s website.
| Date | Status | Borrower | Loan Amount |
|---|---|---|---|
| Previous Owner | Stenzel Joseph L | $72,150 |
Source: Public Records
Tax History
| Year | Tax Paid | Tax Assessment Tax Assessment Total Assessment is a certain percentage of the fair market value that is determined by local assessors to be the total taxable value of land and additions on the property. | Land | Improvement |
|---|---|---|---|---|
| 2025 | $2,113 | $45,700 | $9,100 | $36,600 |
| 2024 | $17 | $40,500 | $9,100 | $31,400 |
| 2023 | $1,990 | $37,000 | $9,100 | $27,900 |
| 2022 | $1,819 | $33,100 | $8,800 | $24,300 |
| 2021 | $1,777 | $24,300 | $5,700 | $18,600 |
| 2020 | $1,765 | $23,000 | $5,700 | $17,300 |
| 2019 | $1,686 | $20,900 | $5,700 | $15,200 |
| 2018 | $1,489 | $20,100 | $5,700 | $14,400 |
| 2017 | $1,432 | $20,100 | $5,700 | $14,400 |
| 2016 | $1,375 | $19,300 | $5,700 | $13,600 |
| 2015 | $1,375 | $18,600 | $11,471 | $7,129 |
| 2014 | $1,375 | $17,800 | $8,604 | $9,196 |
Source: Public Records
Map
Nearby Homes
- 810 Fenton St
- 0 Glenwood Ave
- 800 Jessop Ave
- 702 E Cavanaugh Rd
- 4123 Devonshire Ave
- 4322 Devonshire Ave
- 601 Jessop Ave
- 3611 Homewood Ave
- 600 E Cavanaugh Rd
- 3523 Parkway Dr
- 4500 Devonshire Ave
- 712 Glendale Ave
- 719 Robert St
- 4614 Alpha St
- 630 Julia St
- 522 E Cavanaugh Rd
- 617 Vernon Ave
- 306 E Cavanaugh Rd
- 5008 Southgate Ave
- 3149 Plymouth Dr
- 845 Hunter Blvd
- 841 Hunter Blvd
- 853 Hunter Blvd
- 4104 Glenwood Ave
- 4106 Glenwood Ave
- 835 Hunter Blvd
- 4024 Glenwood Ave
- 821 Jessop Ave
- 833 Hunter Blvd
- 4020 Glenwood Ave
- 863 Hunter Blvd
- 834 Hunter Blvd
- 815 Jessop Ave
- 827 Hunter Blvd
- 4012 Glenwood Ave
- 820 Jessop Ave
- 811 Jessop Ave
- 4105 Glenwood Ave
- 4113 Glenwood Ave
- 823 Hunter Blvd
Your Personal Tour Guide
Ask me questions while you tour the home.