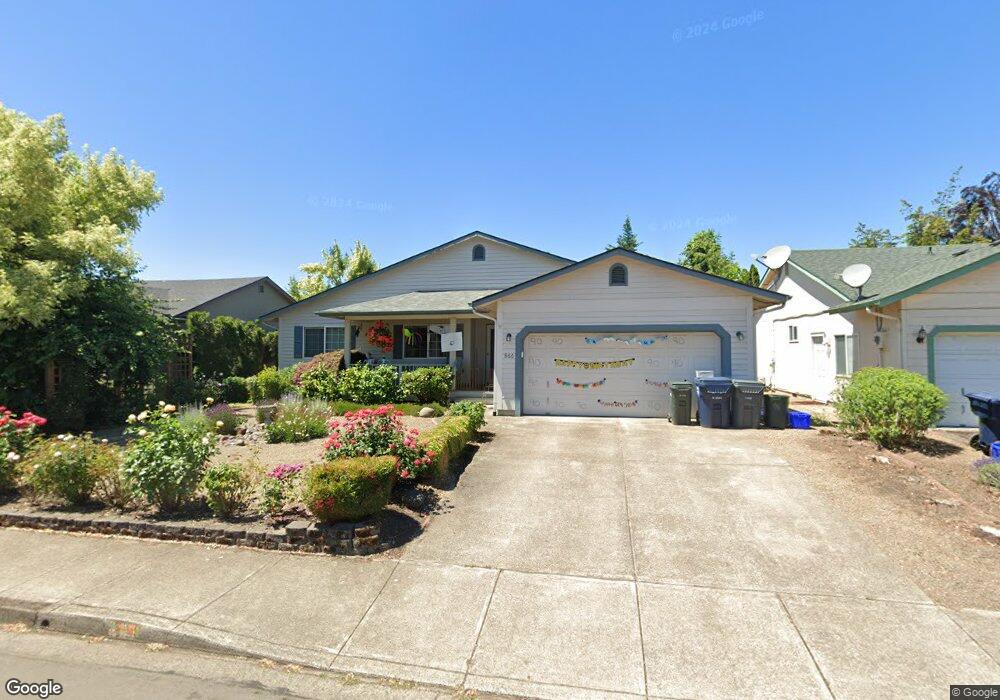
866 S 46th St Springfield, OR 97478
East Springfield NeighborhoodEstimated Value: $391,936 - $437,000
3
Beds
2
Baths
1,448
Sq Ft
$286/Sq Ft
Est. Value
About This Home
This home is located at 866 S 46th St, Springfield, OR 97478 and is currently estimated at $414,484, approximately $286 per square foot. 866 S 46th St is a home located in Lane County with nearby schools including Mt. Vernon Elementary School, Agnes Stewart Middle School, and Thurston High School.
Ownership History
Date
Name
Owned For
Owner Type
Purchase Details
Closed on
Jun 10, 2025
Sold by
Pontious Letha F and Pontious James R
Bought by
Letha F Pontious Trust and Pontious
Current Estimated Value
Purchase Details
Closed on
Sep 28, 2015
Sold by
Wilson Judy K and Stafford Judy K
Bought by
Pontious James R and Pontious Letha F
Home Financials for this Owner
Home Financials are based on the most recent Mortgage that was taken out on this home.
Original Mortgage
$150,500
Interest Rate
3.89%
Mortgage Type
New Conventional
Purchase Details
Closed on
Sep 8, 2009
Sold by
Kelley Sandra A
Bought by
Stafford Marcus E and Stafford Judy K
Home Financials for this Owner
Home Financials are based on the most recent Mortgage that was taken out on this home.
Original Mortgage
$186,202
Interest Rate
5.19%
Mortgage Type
FHA
Create a Home Valuation Report for This Property
The Home Valuation Report is an in-depth analysis detailing your home's value as well as a comparison with similar homes in the area
Home Values in the Area
Average Home Value in this Area
Purchase History
We collect this data history from publicly available records. To have your information removed, we recommend requesting removal directly through your county’s website.
| Date | Buyer | Sale Price | Title Company |
|---|---|---|---|
| Letha F Pontious Trust | -- | None Listed On Document | |
| Pontious James R | $211,000 | Western Title & Escrow Co | |
| Stafford Marcus E | $195,000 | Cascade Title Co |
Source: Public Records
Mortgage History
We collect this data history from publicly available records. To have your information removed, we recommend requesting removal directly through your county’s website.
| Date | Status | Borrower | Loan Amount |
|---|---|---|---|
| Previous Owner | Pontious James R | $150,500 | |
| Previous Owner | Stafford Marcus E | $186,202 |
Source: Public Records
Tax History
| Year | Tax Paid | Tax Assessment Tax Assessment Total Assessment is a certain percentage of the fair market value that is determined by local assessors to be the total taxable value of land and additions on the property. | Land | Improvement |
|---|---|---|---|---|
| 2025 | $4,274 | $233,101 | -- | -- |
| 2024 | $4,205 | $226,312 | -- | -- |
| 2023 | $4,205 | $219,721 | -- | -- |
| 2022 | $3,895 | $213,322 | $0 | $0 |
| 2021 | $3,825 | $207,109 | $0 | $0 |
| 2020 | $3,713 | $201,077 | $0 | $0 |
| 2019 | $3,602 | $195,221 | $0 | $0 |
| 2018 | $3,395 | $184,015 | $0 | $0 |
| 2017 | $3,265 | $184,015 | $0 | $0 |
| 2016 | $3,196 | $178,655 | $0 | $0 |
| 2015 | $3,105 | $173,451 | $0 | $0 |
| 2014 | $3,058 | $168,399 | $0 | $0 |
Source: Public Records
Map
Nearby Homes
- 4608 Holly St
- 934 S 46th St
- 741 S 47th St
- 4493 Glacier St
- 4680 Glacier Meadows Loop
- 4733 Union Terrace
- 4475 Daisy St Unit 87
- 553 S 48th Place
- 4725 Daisy St
- 875 S 43rd St
- 557 S 44th St
- 4946 Holly St
- 4277 Cole Way
- 1171/1173 S 43rd Place
- 4205 Daisy St
- 5254 Holly St
- 5246 Holly St
- 5222 Holly St
- 5230 Holly St
- 5161 Holly St
Your Personal Tour Guide
Ask me questions while you tour the home.