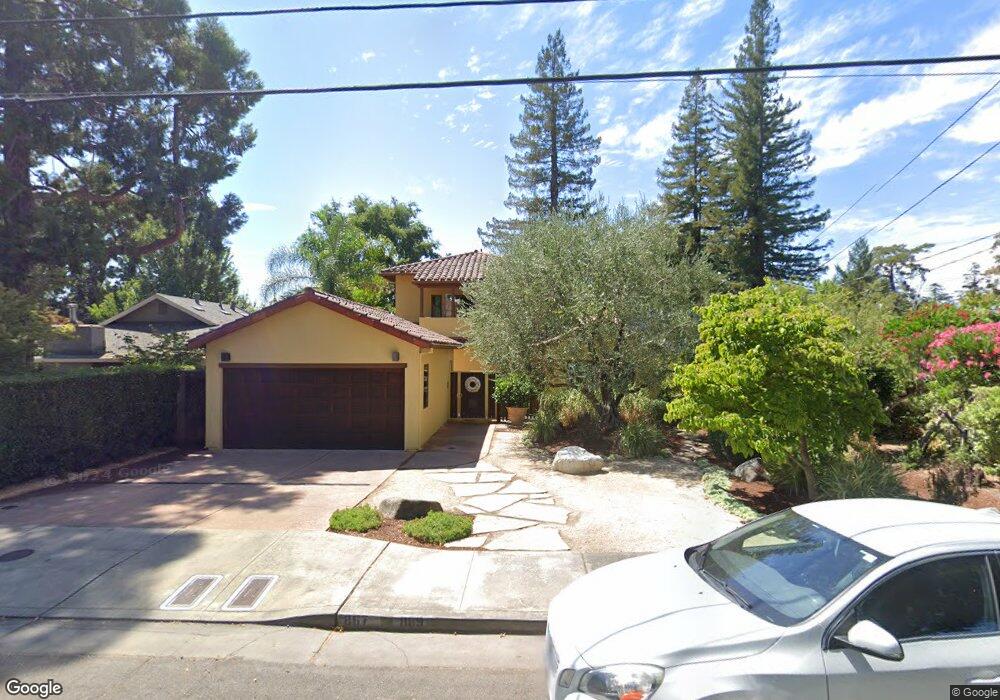
867 2nd St E Sonoma, CA 95476
Estimated Value: $1,832,000 - $2,752,000
4
Beds
3
Baths
2,963
Sq Ft
$737/Sq Ft
Est. Value
About This Home
This home is located at 867 2nd St E, Sonoma, CA 95476 and is currently estimated at $2,184,333, approximately $737 per square foot. 867 2nd St E is a home located in Sonoma County with nearby schools including Prestwood Elementary School, Adele Harrison Middle School, and Creekside High School.
Ownership History
Date
Name
Owned For
Owner Type
Purchase Details
Closed on
Jul 14, 2003
Sold by
Herling Martin
Bought by
Jensen Lance and Jensen Robin
Current Estimated Value
Home Financials for this Owner
Home Financials are based on the most recent Mortgage that was taken out on this home.
Original Mortgage
$322,700
Outstanding Balance
$136,369
Interest Rate
5.18%
Mortgage Type
Commercial
Estimated Equity
$2,047,964
Purchase Details
Closed on
Aug 24, 1999
Sold by
Crowell Lawrence B and Crowell Kathleen M
Bought by
Herling Martin D
Create a Home Valuation Report for This Property
The Home Valuation Report is an in-depth analysis detailing your home's value as well as a comparison with similar homes in the area
Home Values in the Area
Average Home Value in this Area
Purchase History
| Date | Buyer | Sale Price | Title Company |
|---|---|---|---|
| Jensen Lance | $414,700 | New Century Title Co | |
| Herling Martin D | $316,000 | First American Title Co |
Source: Public Records
Mortgage History
| Date | Status | Borrower | Loan Amount |
|---|---|---|---|
| Open | Jensen Lance | $322,700 |
Source: Public Records
Tax History
| Year | Tax Paid | Tax Assessment Tax Assessment Total Assessment is a certain percentage of the fair market value that is determined by local assessors to be the total taxable value of land and additions on the property. | Land | Improvement |
|---|---|---|---|---|
| 2025 | $19,595 | $1,587,249 | $639,796 | $947,453 |
| 2024 | $19,595 | $1,556,127 | $627,251 | $928,876 |
| 2023 | $19,595 | $1,525,615 | $614,952 | $910,663 |
| 2022 | $18,946 | $1,495,702 | $602,895 | $892,807 |
| 2021 | $18,465 | $1,466,375 | $591,074 | $875,301 |
| 2020 | $18,405 | $1,451,340 | $585,014 | $866,326 |
| 2019 | $18,067 | $1,422,884 | $573,544 | $849,340 |
| 2018 | $17,354 | $1,355,770 | $562,299 | $793,471 |
| 2017 | $17,281 | $1,329,187 | $551,274 | $777,913 |
| 2016 | $16,085 | $1,303,125 | $540,465 | $762,660 |
| 2015 | -- | $1,283,552 | $532,347 | $751,205 |
| 2014 | -- | $1,258,410 | $521,920 | $736,490 |
Source: Public Records
Map
Nearby Homes
Your Personal Tour Guide
Ask me questions while you tour the home.