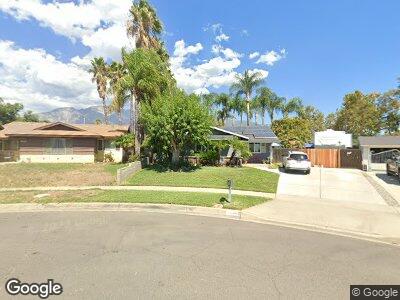
8678 La Paix St Rancho Cucamonga, CA 91701
Estimated Value: $651,527 - $735,000
3
Beds
2
Baths
1,240
Sq Ft
$562/Sq Ft
Est. Value
About This Home
This home is located at 8678 La Paix St, Rancho Cucamonga, CA 91701 and is currently estimated at $697,382, approximately $562 per square foot. 8678 La Paix St is a home located in San Bernardino County with nearby schools including Jasper Elementary, Alta Loma Junior High, and Alta Loma High.
Ownership History
Date
Name
Owned For
Owner Type
Purchase Details
Closed on
Jul 27, 2018
Sold by
Gensel John G
Bought by
Gensel John G and Gensel Trisha A
Current Estimated Value
Purchase Details
Closed on
Nov 6, 2013
Sold by
Tdr Servicing Llc
Bought by
Tdr Servicing Llc
Home Financials for this Owner
Home Financials are based on the most recent Mortgage that was taken out on this home.
Original Mortgage
$63,557
Interest Rate
4.27%
Mortgage Type
Credit Line Revolving
Purchase Details
Closed on
Aug 9, 1996
Sold by
Jam Haberman and Jam Margar Haberman
Bought by
Gensel John G and Gensel Trisha A
Purchase Details
Closed on
Feb 27, 1996
Sold by
Chester Oelhafen Roger Dean
Bought by
Haberman James H and Haberman Margaret L
Create a Home Valuation Report for This Property
The Home Valuation Report is an in-depth analysis detailing your home's value as well as a comparison with similar homes in the area
Home Values in the Area
Average Home Value in this Area
Purchase History
| Date | Buyer | Sale Price | Title Company |
|---|---|---|---|
| Gensel John G | -- | None Available | |
| Tdr Servicing Llc | -- | First American Title Company | |
| Gensel John G | -- | Landsafe Title | |
| Haberman James H | -- | Landsafe Title |
Source: Public Records
Mortgage History
| Date | Status | Borrower | Loan Amount |
|---|---|---|---|
| Open | Gensel John G | $316,500 | |
| Closed | John And Trisha Gensel Family Liv Tr | $320,483 | |
| Closed | Gensel John G | $281,000 | |
| Closed | Tdr Servicing Llc | $63,557 | |
| Previous Owner | Gensel John G | $228,354 | |
| Previous Owner | Gensel John G | $75,000 | |
| Previous Owner | Gensel John G | $263,000 | |
| Previous Owner | Gensel John G | $45,000 | |
| Previous Owner | Gensel John G | $202,650 | |
| Previous Owner | Gensel John G | $31,622 |
Source: Public Records
Tax History Compared to Growth
Tax History
| Year | Tax Paid | Tax Assessment Tax Assessment Total Assessment is a certain percentage of the fair market value that is determined by local assessors to be the total taxable value of land and additions on the property. | Land | Improvement |
|---|---|---|---|---|
| 2024 | $2,468 | $227,671 | $63,871 | $163,800 |
| 2023 | $2,411 | $223,207 | $62,619 | $160,588 |
| 2022 | $2,404 | $218,830 | $61,391 | $157,439 |
| 2021 | $2,401 | $214,539 | $60,187 | $154,352 |
| 2020 | $2,303 | $212,339 | $59,570 | $152,769 |
| 2019 | $2,327 | $208,176 | $58,402 | $149,774 |
| 2018 | $2,274 | $204,094 | $57,257 | $146,837 |
| 2017 | $2,170 | $200,092 | $56,134 | $143,958 |
| 2016 | $2,110 | $196,168 | $55,033 | $141,135 |
| 2015 | $2,096 | $193,221 | $54,206 | $139,015 |
| 2014 | $2,035 | $189,436 | $53,144 | $136,292 |
Source: Public Records
Map
Nearby Homes
- 8672 La Grande St
- 8784 Lurline St
- 8535 La Vine St
- 6880 Topaz St
- 8631 Holly St
- 8776 Holly St
- 8772 Mignonette St
- 8985 Sage Dr
- 7088 Beryl St
- 6713 Coral Ct
- 1526 Cole Ln
- 9026 Hamilton St
- 9118 Baseline Rd
- 1661 Danbrook Place
- 8452 Hawthorne St
- 7563 Alta Cuesta Dr
- 8371 Hawthorne St
- 8990 19th St Unit 426
- 8990 19th St Unit 307
- 8990 19th St Unit 223
- 8678 La Paix St
- 7111 Sonoma Ave
- 8668 La Paix St
- 8681 La Grande St
- 8691 La Grande St
- 8671 La Grande St
- 7121 Sonoma Ave
- 8658 La Paix St
- 8661 La Grande St
- 7120 Sonoma Ave
- 7133 Sonoma Ave
- 8644 La Paix St
- 8682 La Grande St
- 7134 Sonoma Ave
- 8692 La Grande St
- 8651 La Grande St
- 7121 Napa Ave
- 7143 Sonoma Ave
- 8662 La Grande St
- 8633 La Paix St