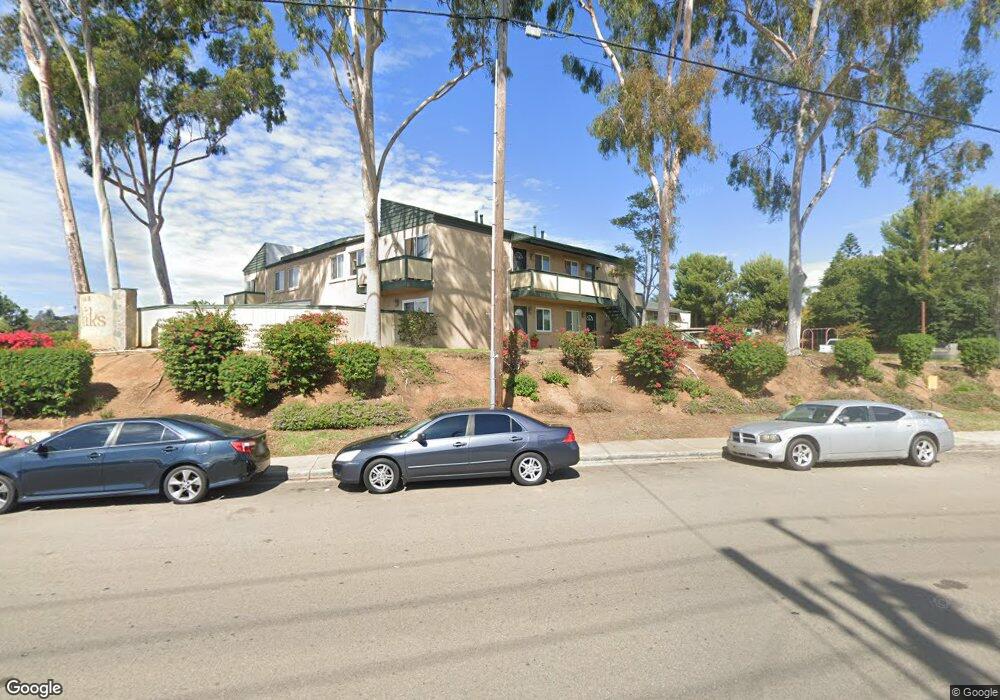
868 E Alvarado St Unit 41 Fallbrook, CA 92028
Estimated Value: $292,763 - $356,000
1
Bed
1
Bath
780
Sq Ft
$417/Sq Ft
Est. Value
About This Home
This home is located at 868 E Alvarado St Unit 41, Fallbrook, CA 92028 and is currently estimated at $325,191, approximately $416 per square foot. 868 E Alvarado St Unit 41 is a home located in San Diego County with nearby schools including William H. Frazier Elementary School, James E. Potter Intermediate School, and Fallbrook High School.
Ownership History
Date
Name
Owned For
Owner Type
Purchase Details
Closed on
Dec 4, 2008
Sold by
Federal National Mortgage Association
Bought by
Sughayer Hassan
Current Estimated Value
Purchase Details
Closed on
Nov 25, 2008
Sold by
Sughayer Hassan
Bought by
Sughayer Hassan and Abukhalaf Nadire
Purchase Details
Closed on
Apr 11, 2007
Sold by
Parks Lucy D
Bought by
Federal National Mortgage Association
Purchase Details
Closed on
Feb 4, 2004
Sold by
Epperson Eric D and Epperson Kristina A
Bought by
Parks Lucy D
Home Financials for this Owner
Home Financials are based on the most recent Mortgage that was taken out on this home.
Original Mortgage
$123,200
Interest Rate
5.8%
Mortgage Type
Purchase Money Mortgage
Purchase Details
Closed on
Aug 20, 2002
Sold by
Avocado Crest Condominiums Llc
Bought by
Epperson Eric D and Epperson Kristina A
Home Financials for this Owner
Home Financials are based on the most recent Mortgage that was taken out on this home.
Original Mortgage
$123,828
Interest Rate
6.37%
Mortgage Type
VA
Create a Home Valuation Report for This Property
The Home Valuation Report is an in-depth analysis detailing your home's value as well as a comparison with similar homes in the area
Home Values in the Area
Average Home Value in this Area
Purchase History
| Date | Buyer | Sale Price | Title Company |
|---|---|---|---|
| Sughayer Hassan | $47,500 | Landamerica | |
| Sughayer Hassan | -- | Accommodation | |
| Sughayer Hassan | -- | Southland Title Company | |
| Federal National Mortgage Association | $129,128 | Accommodation | |
| Parks Lucy D | $154,000 | New Century Title Company | |
| Epperson Eric D | $122,000 | Fidelity National Title Co |
Source: Public Records
Mortgage History
| Date | Status | Borrower | Loan Amount |
|---|---|---|---|
| Previous Owner | Parks Lucy D | $123,200 | |
| Previous Owner | Epperson Eric D | $123,828 |
Source: Public Records
Tax History
| Year | Tax Paid | Tax Assessment Tax Assessment Total Assessment is a certain percentage of the fair market value that is determined by local assessors to be the total taxable value of land and additions on the property. | Land | Improvement |
|---|---|---|---|---|
| 2025 | $661 | $60,827 | $38,623 | $22,204 |
| 2024 | $661 | $59,635 | $37,866 | $21,769 |
| 2023 | $655 | $58,467 | $37,124 | $21,343 |
| 2022 | $654 | $57,322 | $36,397 | $20,925 |
| 2021 | $638 | $56,199 | $35,684 | $20,515 |
| 2020 | $646 | $55,624 | $35,319 | $20,305 |
| 2019 | $638 | $54,534 | $34,627 | $19,907 |
| 2018 | $628 | $53,466 | $33,949 | $19,517 |
| 2017 | $616 | $52,419 | $33,284 | $19,135 |
| 2016 | $598 | $51,392 | $32,632 | $18,760 |
| 2015 | $584 | $50,621 | $32,142 | $18,479 |
| 2014 | $574 | $49,631 | $31,513 | $18,118 |
Source: Public Records
Map
Nearby Homes
- 868 E Alvarado St Unit 7
- 868 E Alvarado St Unit 47
- 741 Rossiter Ln
- 113 Gardenside Ct
- 678 Robby Way
- 535 Shady Glen Dr
- 502 E Elder St
- 1120 E Mission Rd Unit 33
- 1120 E Mission Rd Unit 39
- 1120 E Mission Rd Unit 76
- 1120 E Mission Rd Unit 44
- 1120 E Mission Rd Unit 22
- 1120 E Mission Rd Unit 102
- 1120 E Mission Rd Unit 20
- 1120 E Mission Rd Unit 79
- 1120 E Mission Rd Unit 57
- 508 Village View Place
- 0 Via Vonnie Unit SW26054903
- 210 S Orange Ave
- 842 Porter Way
- 868 E Alvarado St Unit 868 E. Alvarado St.
- 868 E Alvarado St Unit 3
- 868 E Alvarado St Unit 45
- 868 E Alvarado St Unit 44
- 868 E Alvarado St Unit 43
- 868 E Alvarado St Unit 42
- 868 E Alvarado St Unit 38
- 868 E Alvarado St Unit 35
- 868 E Alvarado St Unit 34
- 868 E Alvarado St Unit 32
- 868 E Alvarado St Unit 31
- 868 E Alvarado St Unit 26
- 868 E Alvarado St Unit 24
- 868 E Alvarado St Unit 22
- 868 E Alvarado St Unit 19
- 868 E Alvarado St Unit 16
- 868 E Alvarado St Unit 23
- 868 E Alvarado St Unit 1
- 868 E Alvarado St Unit 12
- 868 E Alvarado St Unit 40
Your Personal Tour Guide
Ask me questions while you tour the home.