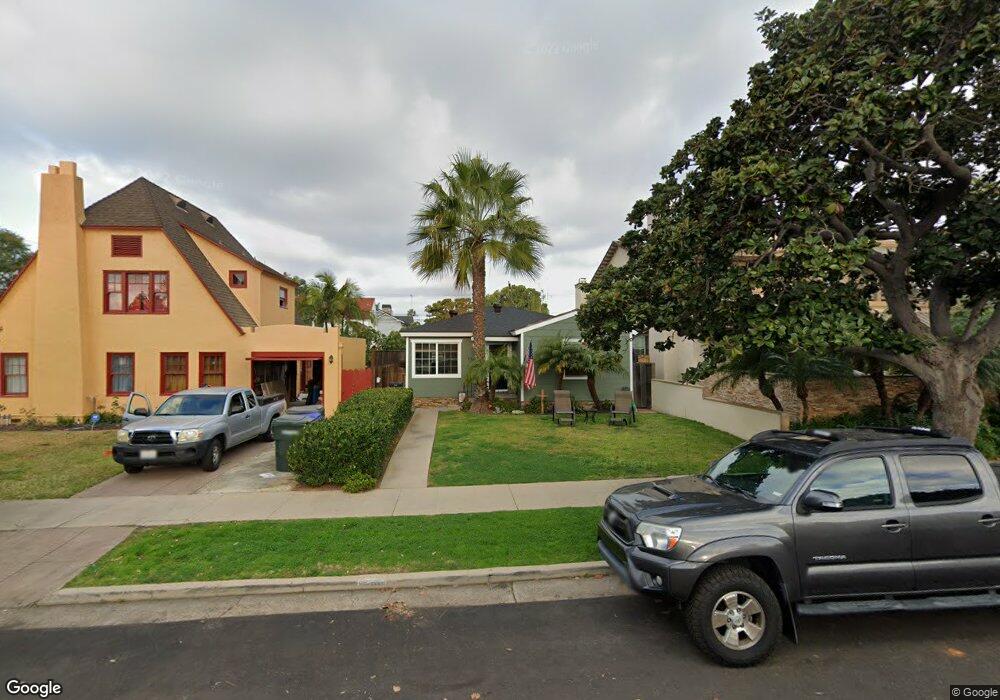
868 I Ave Coronado, CA 92118
Estimated Value: $1,943,437 - $3,125,000
2
Beds
1
Bath
798
Sq Ft
$2,944/Sq Ft
Est. Value
About This Home
This home is located at 868 I Ave, Coronado, CA 92118 and is currently estimated at $2,349,109, approximately $2,943 per square foot. 868 I Ave is a home located in San Diego County with nearby schools including Coronado Village Elementary, Coronado Middle School, and Coronado High School.
Ownership History
Date
Name
Owned For
Owner Type
Purchase Details
Closed on
Apr 6, 2017
Sold by
Austin Linda Elizabeth
Bought by
Austin Linda Elizabeth
Current Estimated Value
Purchase Details
Closed on
Jan 17, 2012
Sold by
Austin Isabel Romelia
Bought by
Austin Isabel Romelia
Purchase Details
Closed on
Dec 9, 2006
Sold by
Austin Isabel Romelia
Bought by
Austin Isabel Romelia
Home Financials for this Owner
Home Financials are based on the most recent Mortgage that was taken out on this home.
Original Mortgage
$100,000
Interest Rate
6.32%
Mortgage Type
New Conventional
Create a Home Valuation Report for This Property
The Home Valuation Report is an in-depth analysis detailing your home's value as well as a comparison with similar homes in the area
Home Values in the Area
Average Home Value in this Area
Purchase History
| Date | Buyer | Sale Price | Title Company |
|---|---|---|---|
| Austin Linda Elizabeth | -- | None Available | |
| Austin Isabel Romelia | -- | None Available | |
| Austin Isabel Romelia | -- | Ticor Title |
Source: Public Records
Mortgage History
| Date | Status | Borrower | Loan Amount |
|---|---|---|---|
| Closed | Austin Isabel Romelia | $100,000 |
Source: Public Records
Tax History
| Year | Tax Paid | Tax Assessment Tax Assessment Total Assessment is a certain percentage of the fair market value that is determined by local assessors to be the total taxable value of land and additions on the property. | Land | Improvement |
|---|---|---|---|---|
| 2025 | $1,603 | $93,258 | $48,943 | $44,315 |
| 2024 | $1,603 | $91,431 | $47,984 | $43,447 |
| 2023 | $1,586 | $89,640 | $47,044 | $42,596 |
| 2022 | $1,567 | $87,883 | $46,122 | $41,761 |
| 2021 | $1,553 | $86,161 | $45,218 | $40,943 |
| 2020 | $1,526 | $85,279 | $44,755 | $40,524 |
| 2019 | $1,523 | $83,608 | $43,878 | $39,730 |
| 2018 | $1,507 | $81,969 | $43,018 | $38,951 |
| 2017 | $1,451 | $80,363 | $42,175 | $38,188 |
| 2016 | $1,383 | $78,789 | $41,349 | $37,440 |
| 2015 | $1,330 | $77,606 | $40,728 | $36,878 |
| 2014 | $1,266 | $76,087 | $39,931 | $36,156 |
Source: Public Records
Map
Nearby Homes
- 812 H Ave
- 920 Country Club Ln
- 909 Olive Ave
- 1100 Pine St
- 1027 G Ave
- 910 Balboa Ave
- 848 E Ave Unit L2
- 811 10th St
- 535 Ocean Blvd
- 740 Coronado Ave
- 1100 Coronado Ave
- 911 9th St
- 1058 Isabella Ave
- 1054 Isabella Ave Unit 58
- 1074 Isabella Ave
- 1064 Isabella Ave Unit F
- 1060 Isabella Ave
- 620 Coronado Ave
- 1056 Isabella Ave
- 835 D Ave Unit 5
Your Personal Tour Guide
Ask me questions while you tour the home.