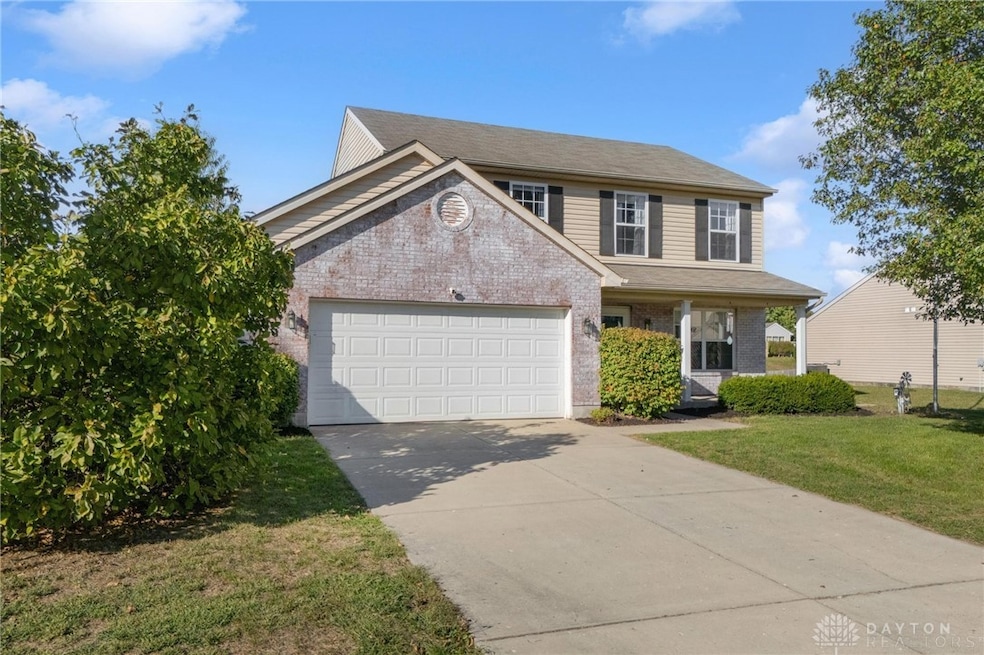
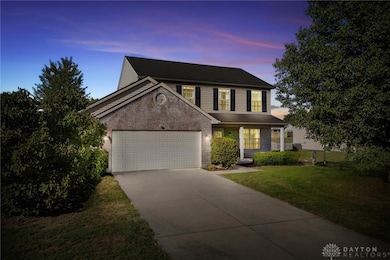
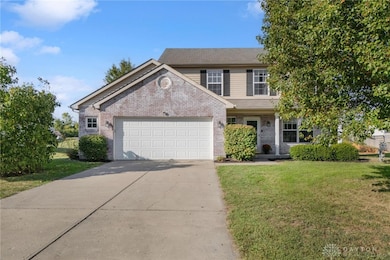
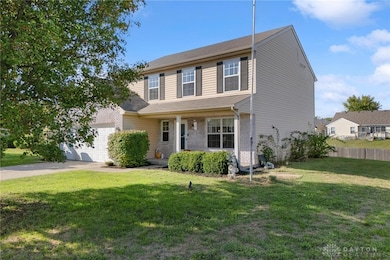

8680 Plum Creek Ct Franklin, OH 45005
Estimated payment $1,818/month
Highlights
- No HOA
- Bathroom on Main Level
- Forced Air Heating and Cooling System
- 2 Car Attached Garage
About This Home
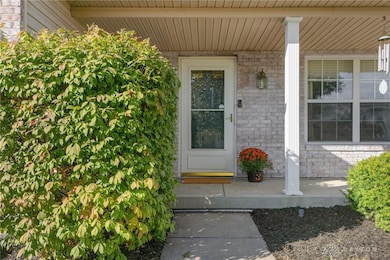
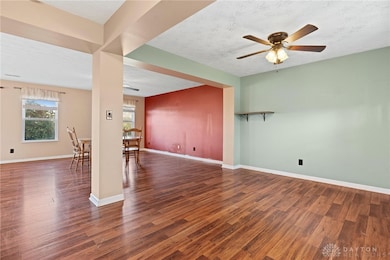
Welcome to your beautiful Cristo home located in Franklin Township within Carlisle Schools! This spacious 3-bedroom, 2.5-bathroom home offers over 1,800 sq. ft. of comfortable living space. The large master bedroom provides a relaxing retreat, while the open layout creates a perfect flow for entertaining family and friends. Don’t miss the opportunity to make this move-in ready home yours! *Motivated Sellers*
Listing Agent
Bella Realty Group Brokerage Phone: 937-681-1398 License #2019002667 Listed on: 12/05/2025
Home Details
Home Type
- Single Family
Est. Annual Taxes
- $2,940
Year Built
- 2006
Lot Details
- 0.32 Acre Lot
Parking
- 2 Car Attached Garage
Home Design
- Brick Exterior Construction
- Slab Foundation
- Vinyl Siding
Interior Spaces
- 1,828 Sq Ft Home
- 2-Story Property
Bedrooms and Bathrooms
- 3 Bedrooms
- Bathroom on Main Level
Utilities
- Forced Air Heating and Cooling System
- Heating System Uses Natural Gas
Community Details
- No Home Owners Association
- Country Walk 3 Subdivision
Listing and Financial Details
- Assessor Parcel Number 02063620790
Map
Home Values in the Area
Average Home Value in this Area
Tax History
| Year | Tax Paid | Tax Assessment Tax Assessment Total Assessment is a certain percentage of the fair market value that is determined by local assessors to be the total taxable value of land and additions on the property. | Land | Improvement |
|---|---|---|---|---|
| 2024 | $2,940 | $77,430 | $17,500 | $59,930 |
| 2023 | $2,370 | $57,057 | $9,607 | $47,449 |
| 2022 | $2,356 | $57,057 | $9,608 | $47,450 |
| 2021 | $2,274 | $57,057 | $9,608 | $47,450 |
| 2020 | $2,133 | $46,767 | $7,875 | $38,892 |
| 2019 | $2,161 | $46,767 | $7,875 | $38,892 |
| 2018 | $2,166 | $46,767 | $7,875 | $38,892 |
| 2017 | $2,160 | $43,180 | $7,389 | $35,791 |
| 2016 | $1,880 | $43,180 | $7,389 | $35,791 |
| 2015 | $1,885 | $43,180 | $7,389 | $35,791 |
| 2014 | $1,672 | $37,880 | $6,480 | $31,400 |
| 2013 | $1,641 | $51,120 | $8,750 | $42,370 |
Property History
| Date | Event | Price | List to Sale | Price per Sq Ft |
|---|---|---|---|---|
| 12/05/2025 12/05/25 | For Sale | $299,900 | -- | $164 / Sq Ft |
Purchase History
| Date | Type | Sale Price | Title Company |
|---|---|---|---|
| Warranty Deed | $219,000 | None Available | |
| Corporate Deed | $146,433 | Fidelity Land Title | |
| Warranty Deed | -- | None Available | |
| Warranty Deed | -- | None Available |
Mortgage History
| Date | Status | Loan Amount | Loan Type |
|---|---|---|---|
| Open | $215,033 | FHA | |
| Previous Owner | $146,420 | Purchase Money Mortgage |
Source: Dayton REALTORS®
MLS Number: 948903
APN: 02-06-362-079
Disclaimer: Certain information contained herein is derived from information provided by parties other than Homes.com. All information provided is deemed reliable, but is not guaranteed to be accurate and should be independently verified.
![]() The information is being provided by Dayton Area Board of Realtors MLS. Information deemed reliable but not guaranteed. Information is provided for the consumer's personal, non-commercial use, and may not be used for any purpose other than the identification of potential properties for purchase. Copyright 2025 Dayton Area Board of Realtors MLS. All Rights Reserved.
The information is being provided by Dayton Area Board of Realtors MLS. Information deemed reliable but not guaranteed. Information is provided for the consumer's personal, non-commercial use, and may not be used for any purpose other than the identification of potential properties for purchase. Copyright 2025 Dayton Area Board of Realtors MLS. All Rights Reserved.
- 8676 Sweetbriar Ct
- 7403 Brookstone Dr
- 7331 Pinewood Dr
- 7150 Country Walk Dr
- 7103 Country Walk Dr
- 6933 Torrington Dr
- 6828 Torrington Dr
- 6704 Berwick Dr
- 6496 Lorraine Dr
- 7510 Martz Paulin Rd
- 7885 Timberview Ct
- 7877 Timberview Ct
- 7286 Timber Wolf Dr
- 7368 Timber Wolf Dr
- 7836 Timberwind Trail
- Solstice Plan at The Reserves of Waterbury Village - Prestige
- Moonhaven Plan at The Reserves of Waterbury Village - Royal
- 1225 Waterbury Dr
- Silverstone Plan at The Reserves of Waterbury Village - Royal
- Oxford Plan at The Reserves of Waterbury Village - Prestige
- 950 Dubois Rd
- 5019 Waterford Ln
- 5019 Waterford Dr
- 2318 Woodburn Ave
- 601 Moses Dr Unit 1
- 101 N Main St Unit 3
- 5017 Waterford Ln
- 1805 Columbia Ave
- 8967 Cam Dr
- 2 Emerald Way
- 1331 Trinity Place
- 1507 Manchester Ave
- 154 Bavarian St
- 510 Arlington Dr
- 1221 Jackson Ln
- 1112 Girard Ave
- 1420 Villa Ct Unit A
- 5549 Innovation Dr
- 2150 S Breiel Blvd
- 3530 Village Dr
