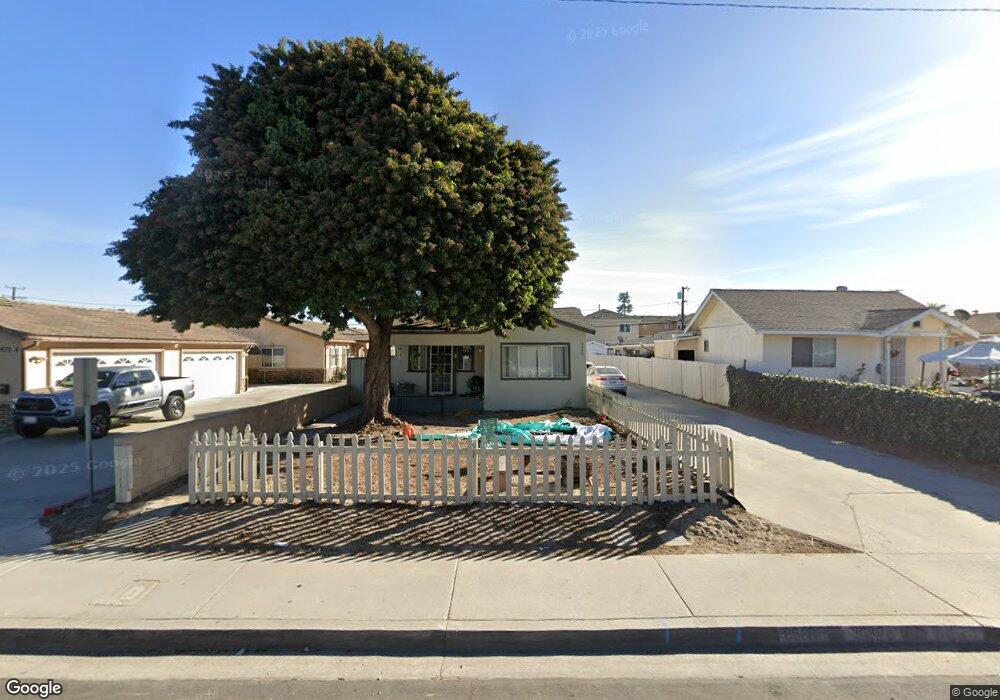
8686 Sumner Place Cypress, CA 90630
Estimated Value: $817,011 - $1,112,000
1
Bed
3
Baths
588
Sq Ft
$1,662/Sq Ft
Est. Value
About This Home
This home is located at 8686 Sumner Place, Cypress, CA 90630 and is currently estimated at $977,503, approximately $1,662 per square foot. 8686 Sumner Place is a home located in Orange County with nearby schools including Clara J. King Elementary School, Walker Junior High School, and John F. Kennedy High School.
Ownership History
Date
Name
Owned For
Owner Type
Purchase Details
Closed on
Dec 22, 2014
Sold by
Sutherlin Jonathan C and Sutherlin Leann I
Bought by
Sutherlin Family Trust
Current Estimated Value
Purchase Details
Closed on
Nov 11, 2002
Sold by
Sutherlin Jonathan C and Sutherlin Leann I
Bought by
Sutherlin Jonathan C and Sutherlin Leann I
Home Financials for this Owner
Home Financials are based on the most recent Mortgage that was taken out on this home.
Original Mortgage
$251,025
Interest Rate
5.95%
Mortgage Type
Purchase Money Mortgage
Purchase Details
Closed on
Sep 25, 2002
Sold by
Tsui Roger and Tsui Rebecca
Bought by
Sutherlin Jonathan C and Sutherlin Leann I
Home Financials for this Owner
Home Financials are based on the most recent Mortgage that was taken out on this home.
Original Mortgage
$251,025
Interest Rate
5.95%
Mortgage Type
Purchase Money Mortgage
Create a Home Valuation Report for This Property
The Home Valuation Report is an in-depth analysis detailing your home's value as well as a comparison with similar homes in the area
Home Values in the Area
Average Home Value in this Area
Purchase History
| Date | Buyer | Sale Price | Title Company |
|---|---|---|---|
| Sutherlin Family Trust | -- | Accommodation | |
| Sutherlin Jonathan C | -- | -- | |
| Sutherlin Jonathan C | $335,500 | Lawyers Title Company |
Source: Public Records
Mortgage History
| Date | Status | Borrower | Loan Amount |
|---|---|---|---|
| Previous Owner | Sutherlin Jonathan C | $251,025 |
Source: Public Records
Tax History
| Year | Tax Paid | Tax Assessment Tax Assessment Total Assessment is a certain percentage of the fair market value that is determined by local assessors to be the total taxable value of land and additions on the property. | Land | Improvement |
|---|---|---|---|---|
| 2025 | $5,969 | $485,546 | $387,938 | $97,608 |
| 2024 | $5,969 | $476,026 | $380,331 | $95,695 |
| 2023 | $5,827 | $466,693 | $372,874 | $93,819 |
| 2022 | $5,752 | $457,543 | $365,563 | $91,980 |
| 2021 | $5,678 | $448,572 | $358,395 | $90,177 |
| 2020 | $5,653 | $443,973 | $354,720 | $89,253 |
| 2019 | $5,506 | $435,268 | $347,765 | $87,503 |
| 2018 | $5,433 | $426,734 | $340,946 | $85,788 |
| 2017 | $5,256 | $418,367 | $334,261 | $84,106 |
| 2016 | $5,211 | $410,164 | $327,707 | $82,457 |
| 2015 | $5,171 | $404,003 | $322,784 | $81,219 |
| 2014 | $4,910 | $396,090 | $316,461 | $79,629 |
Source: Public Records
Map
Nearby Homes
- 4891 Grace Ave
- 8762 La Salle St
- 8689 Moody St
- 8521 Via Tina
- 8342 Fontainbleau Way
- 9066 Candlestick Ln Unit 5
- 8792 Grindlay St
- 9220 Whitney Way
- 4932 Windsong Ave
- 4811 Newman Ave
- 12750 Centralia St Unit 191
- 12750 Centralia St Unit 76
- 5201 Del Serra Cir
- 8622 Watson St
- 8032 Lancashire Cir
- 9080 Bloomfield Ave
- 9080 Bloomfield Ave
- 9080 Bloomfield Ave Unit 257
- 9080 Bloomfield Ave Unit 223
- 9080 Bloomfield Ave Unit 255
- 8694 Sumner Place
- 8672 Sumner Place
- 8706 Sumner Place
- 8662 Sumner Place
- 8712 Sumner Place
- 8703 Belmont St
- 8705 Belmont St
- 8652 Sumner Place
- 8691 Belmont St
- 8722 Sumner Place
- 8671 Belmont St
- 8651 Belmont St
- 8661 Belmont St
- 4772 Grace St
- 4776 Grace Ave
- 4752 Grace Ave
- 4742 Grace Ave
- 4774 Grace Ave
- 4771 Merten Ave
- 8736 Sumner Place
Your Personal Tour Guide
Ask me questions while you tour the home.