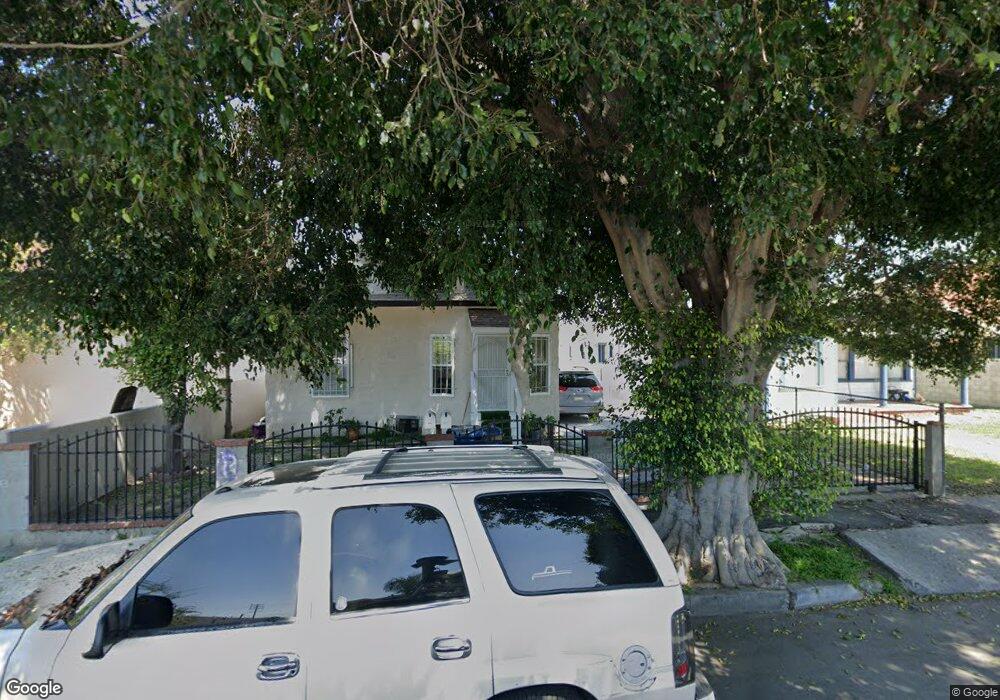
869 E 56th St Los Angeles, CA 90011
South Park NeighborhoodEstimated Value: $720,721 - $1,225,000
4
Beds
3
Baths
1,826
Sq Ft
$512/Sq Ft
Est. Value
About This Home
This home is located at 869 E 56th St, Los Angeles, CA 90011 and is currently estimated at $934,680, approximately $511 per square foot. 869 E 56th St is a home with nearby schools including Estrella Elementary School, Los Angeles Academy Middle School, and Thomas Jefferson Senior High School.
Ownership History
Date
Name
Owned For
Owner Type
Purchase Details
Closed on
Oct 3, 2023
Sold by
Ochoa Alicia Rocio
Bought by
Alicia Rocio Ochoa Living Trust and Ochoa
Current Estimated Value
Purchase Details
Closed on
Dec 18, 2009
Sold by
Ochoa Jose Antonio
Bought by
Ochoa Alicia Rocio
Purchase Details
Closed on
May 16, 2008
Sold by
Espinoza Labra Marco Antonio Ochoa and Espinoza De Ochoa Daniela Yamali
Bought by
Ochoa Jose Antonio and Ochoa Alicia Rocio
Purchase Details
Closed on
Apr 17, 2008
Sold by
Ochoa Jose Antonio0 and Ochoa Alicia Rocio
Bought by
Ochoa Labra Marco Antonio and Espinoza De Ochoa Daniela Yanali
Purchase Details
Closed on
Sep 12, 1997
Sold by
Ochoa Efrain and Ochoa Jose A
Bought by
Ochoa Jose Antonio and Ochoa Alicia Rocio
Home Financials for this Owner
Home Financials are based on the most recent Mortgage that was taken out on this home.
Original Mortgage
$142,000
Interest Rate
7.45%
Create a Home Valuation Report for This Property
The Home Valuation Report is an in-depth analysis detailing your home's value as well as a comparison with similar homes in the area
Home Values in the Area
Average Home Value in this Area
Purchase History
| Date | Buyer | Sale Price | Title Company |
|---|---|---|---|
| Alicia Rocio Ochoa Living Trust | -- | None Listed On Document | |
| Ochoa Alicia Rocio | -- | None Available | |
| Ochoa Jose Antonio | -- | None Available | |
| Ochoa Labra Marco Antonio | $400,000 | None Available | |
| Ochoa Jose Antonio | -- | Benefit Land Title |
Source: Public Records
Mortgage History
| Date | Status | Borrower | Loan Amount |
|---|---|---|---|
| Previous Owner | Ochoa Jose Antonio | $142,000 |
Source: Public Records
Tax History Compared to Growth
Tax History
| Year | Tax Paid | Tax Assessment Tax Assessment Total Assessment is a certain percentage of the fair market value that is determined by local assessors to be the total taxable value of land and additions on the property. | Land | Improvement |
|---|---|---|---|---|
| 2025 | $3,398 | $264,014 | $120,374 | $143,640 |
| 2024 | $3,398 | $258,838 | $118,014 | $140,824 |
| 2023 | $3,336 | $253,763 | $115,700 | $138,063 |
| 2022 | $3,188 | $248,788 | $113,432 | $135,356 |
| 2021 | $3,140 | $243,910 | $111,208 | $132,702 |
| 2020 | $3,166 | $241,410 | $110,068 | $131,342 |
| 2019 | $3,050 | $236,677 | $107,910 | $128,767 |
| 2018 | $2,938 | $232,038 | $105,795 | $126,243 |
| 2016 | $2,790 | $223,030 | $101,688 | $121,342 |
| 2015 | $2,750 | $219,681 | $100,161 | $119,520 |
| 2014 | $2,770 | $215,378 | $98,199 | $117,179 |
Source: Public Records
Map
Nearby Homes
- 911 E 55th St
- 939 E 55th St
- 995 E 55th St
- 1018 E 57th St
- 859 E 53rd St Unit 2
- 904 E 52nd Place
- 768 E 52nd Place
- 5630 S Central Ave
- 765 E 52nd Place
- 626 E 54th St
- 766 E 52nd St
- 1132 E 53rd St
- 1008 E 51st St
- 696 E 51st St
- 1212 E 54th St
- 685 E 51st St
- 907 E 50th St
- 420 E 51st St
- 940 E 49th St
- 1141 E 50th St