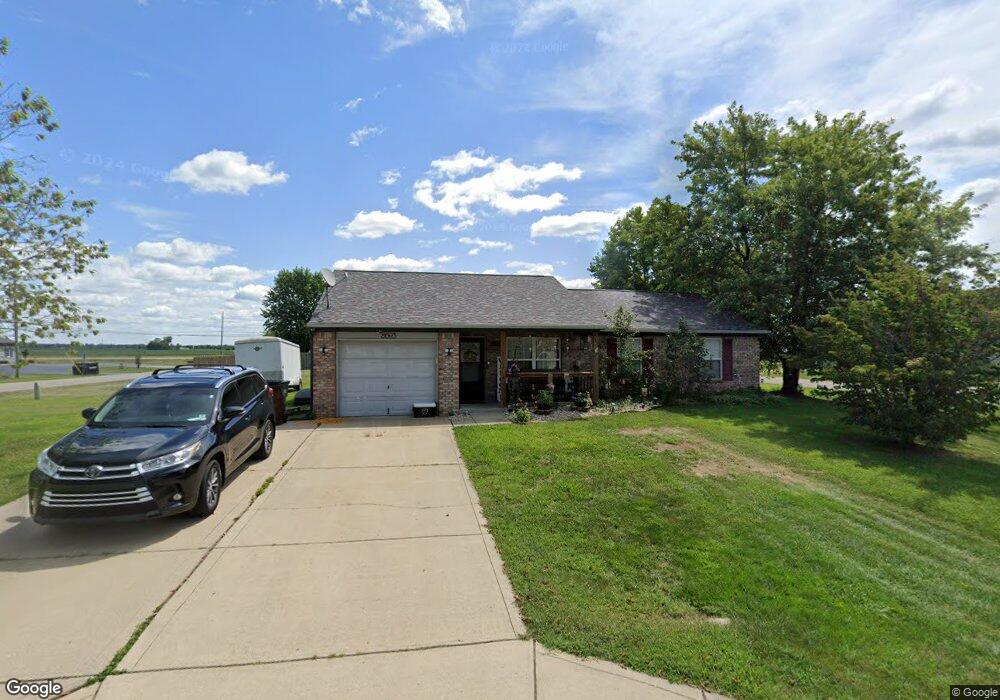
8693 N Burbrink Dr Columbus, IN 47201
Estimated Value: $208,929 - $227,000
3
Beds
1
Bath
1,181
Sq Ft
$187/Sq Ft
Est. Value
About This Home
This home is located at 8693 N Burbrink Dr, Columbus, IN 47201 and is currently estimated at $220,482, approximately $186 per square foot. 8693 N Burbrink Dr is a home located in Bartholomew County with nearby schools including Taylorsville Elementary School, Northside Middle School, and Columbus North High School.
Ownership History
Date
Name
Owned For
Owner Type
Purchase Details
Closed on
Oct 25, 2015
Sold by
Hall Charles and Hall Nicole M
Bought by
Hall Charles and Hall Nicole M
Current Estimated Value
Purchase Details
Closed on
May 11, 2009
Sold by
Taylor Bean & Whitaker Mortgage Corp
Bought by
Secretary Of Housing And Urban Developme
Purchase Details
Closed on
Jan 14, 2009
Sold by
Sheriff Of Bartholomew County
Bought by
Taylor Bean & Whitaker Mortgage Corp
Purchase Details
Closed on
May 29, 2007
Sold by
Sanders Doris E
Bought by
Shackleford Timothy
Purchase Details
Closed on
Oct 7, 2006
Sold by
Secretary Housing Urban Development
Bought by
Ritzline Nicoole M
Purchase Details
Closed on
Mar 25, 1998
Sold by
Crossmann Communities Part
Bought by
Strickford Doris E
Create a Home Valuation Report for This Property
The Home Valuation Report is an in-depth analysis detailing your home's value as well as a comparison with similar homes in the area
Home Values in the Area
Average Home Value in this Area
Purchase History
| Date | Buyer | Sale Price | Title Company |
|---|---|---|---|
| Hall Charles | -- | Attorney | |
| Secretary Of Housing And Urban Developme | -- | None Available | |
| Taylor Bean & Whitaker Mortgage Corp | $107,794 | None Available | |
| Shackleford Timothy | -- | None Available | |
| Ritzline Nicoole M | -- | None Available | |
| Strickford Doris E | $87,500 | -- |
Source: Public Records
Mortgage History
| Date | Status | Borrower | Loan Amount |
|---|---|---|---|
| Closed | Taylor Bean & Whitaker Mortgage Corp | $0 |
Source: Public Records
Tax History Compared to Growth
Tax History
| Year | Tax Paid | Tax Assessment Tax Assessment Total Assessment is a certain percentage of the fair market value that is determined by local assessors to be the total taxable value of land and additions on the property. | Land | Improvement |
|---|---|---|---|---|
| 2024 | $809 | $155,600 | $38,400 | $117,200 |
| 2023 | $720 | $148,100 | $38,400 | $109,700 |
| 2022 | $983 | $147,000 | $38,400 | $108,600 |
| 2021 | $831 | $130,800 | $24,900 | $105,900 |
| 2020 | $576 | $104,200 | $24,900 | $79,300 |
| 2019 | $491 | $102,100 | $24,900 | $77,200 |
| 2018 | $450 | $97,600 | $24,900 | $72,700 |
| 2017 | $435 | $96,100 | $24,900 | $71,200 |
| 2016 | $443 | $97,000 | $24,900 | $72,100 |
| 2014 | $439 | $95,100 | $24,900 | $70,200 |
Source: Public Records
Map
Nearby Homes
- 8312 Devonshire Rd
- 8145 Sunset Ct
- 9117 Main St
- 1238 Mulberry St
- 2462 W Southwind Ct
- 2034 Buckthorn Dr
- 10331 N 50 W
- 5224 N Vance St
- 7265 N 400 W
- 5065 Adkins St
- 4986 Adkins St
- 4910 N 200 W
- 7020 N 400 W
- 1756 Pinion Ct
- 13131 N 200 W
- 950 Cottonwood Dr
- 0 River Rd
- 650 North St
- Bradford Plan at Abbey - Commons
- Norway Plan at Abbey - Commons
- 2150 W van Arsdall Ct
- 8692 N Burbrink Dr
- 2120 W van Arsdall Ct
- 8662 N Burbrink Dr
- 2149 W van Arsdall Ct
- 8632 N Burbrink Dr
- 2119 W van Arsdall Ct
- 2261 Random Rd
- 2090 W van Arsdall Ct
- 8602 N Burbrink Dr
- 2059 W van Arsdall Ct
- 2178 Miller Ct
- 2148 Miller Ct
- 2291 Random Rd
- 2089 W van Arsdall Ct
- 8572 N Burbrink Dr
- 2118 Miller Ct
- 2088 Miller Ct
- 2311 Random Rd
- 8542 N Burbrink Dr