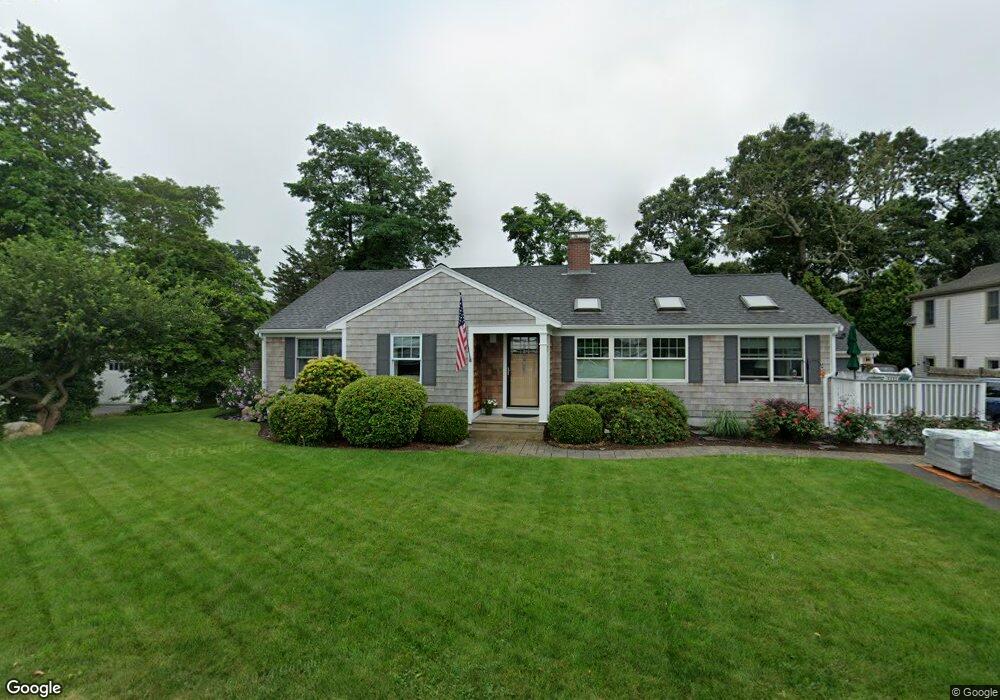
87 Cedar Point Dr Pocasset, MA 02559
Pocasset NeighborhoodEstimated Value: $1,008,000 - $1,275,000
3
Beds
2
Baths
1,501
Sq Ft
$739/Sq Ft
Est. Value
About This Home
This home is located at 87 Cedar Point Dr, Pocasset, MA 02559 and is currently estimated at $1,109,610, approximately $739 per square foot. 87 Cedar Point Dr is a home located in Barnstable County with nearby schools including Bourne High School and Cadence Academy Preschool - Bourne.
Ownership History
Date
Name
Owned For
Owner Type
Purchase Details
Closed on
Jan 4, 2013
Sold by
Waite Rosemary E and Waite Stephen F
Bought by
Rasc T and Waite Rosemary E
Current Estimated Value
Home Financials for this Owner
Home Financials are based on the most recent Mortgage that was taken out on this home.
Original Mortgage
$198,700
Outstanding Balance
$138,902
Interest Rate
3.41%
Estimated Equity
$970,708
Purchase Details
Closed on
Oct 15, 1997
Sold by
Wood Kenneth A and Wood Janice
Bought by
Waite Stephan F and Waite Rosemary E
Home Financials for this Owner
Home Financials are based on the most recent Mortgage that was taken out on this home.
Original Mortgage
$152,500
Interest Rate
7.46%
Mortgage Type
Purchase Money Mortgage
Purchase Details
Closed on
May 6, 1994
Sold by
Rando Robert J and Rando Anne C
Bought by
Wood Kenneth A and Wood Janice
Create a Home Valuation Report for This Property
The Home Valuation Report is an in-depth analysis detailing your home's value as well as a comparison with similar homes in the area
Home Values in the Area
Average Home Value in this Area
Purchase History
| Date | Buyer | Sale Price | Title Company |
|---|---|---|---|
| Rasc T | -- | -- | |
| Rasc T T | -- | -- | |
| Waite Stephan F | $252,500 | -- | |
| Waite Stephan F | $252,500 | -- | |
| Wood Kenneth A | $215,000 | -- | |
| Wood Kenneth A | $215,000 | -- |
Source: Public Records
Mortgage History
| Date | Status | Borrower | Loan Amount |
|---|---|---|---|
| Open | Wood Kenneth A | $198,700 | |
| Previous Owner | Wood Kenneth A | $150,000 | |
| Previous Owner | Wood Kenneth A | $152,500 |
Source: Public Records
Tax History Compared to Growth
Tax History
| Year | Tax Paid | Tax Assessment Tax Assessment Total Assessment is a certain percentage of the fair market value that is determined by local assessors to be the total taxable value of land and additions on the property. | Land | Improvement |
|---|---|---|---|---|
| 2025 | $8,162 | $1,045,100 | $704,600 | $340,500 |
| 2024 | $7,982 | $995,200 | $671,000 | $324,200 |
| 2023 | $7,633 | $866,400 | $593,800 | $272,600 |
| 2022 | $7,499 | $743,200 | $525,500 | $217,700 |
| 2021 | $8,454 | $785,000 | $585,900 | $199,100 |
| 2020 | $8,282 | $771,100 | $580,300 | $190,800 |
| 2019 | $6,878 | $654,400 | $473,700 | $180,700 |
| 2018 | $6,489 | $615,700 | $451,200 | $164,500 |
| 2017 | $6,280 | $609,700 | $446,900 | $162,800 |
| 2016 | $5,929 | $583,600 | $447,000 | $136,600 |
| 2015 | $5,427 | $538,900 | $402,300 | $136,600 |
Source: Public Records
Map
Nearby Homes
- 22 Nairn Rd
- 48 Red Brook Harbor Rd
- 3 Red Brook Pond Dr
- 171 Bellavista Dr
- 1094 County Rd
- 75 Winsor Rd
- 34 Kenwood Rd
- 45 Kenwood Rd
- 10 Squeteague Harbor Rd
- 940 County Rd
- 89 Harbor Dr
- 70 Wings Neck Rd
- 254 Barlows Landing Rd
- 24 Richmond Rd
- 250 Scraggy Neck Rd
- 1234 Route 28a
- 1234 Route 28a
- 940 County Rd
- 709 County Rd
- 14 Navajo Rd
- 83 Cedar Point Dr
- 93 Cedar Point Dr
- 100 Cedar Point Dr
- 98 Elgin Rd
- 102 Elgin Rd
- 79 Cedar Point Dr
- 80 Cedar Point Dr
- 104 Cedar Point Dr
- 94 Elgin Rd
- 105 Cedar Point Dr
- 102 Cedar Point Dr
- 80 Elgin Rd
- 75 Cedar Point Dr
- 106 Elgin Rd
- 76 Elgin Rd
- 95 Elgin Rd
- 76 Cedar Point Dr
- 84 Elgin Rd
- 71 Cedar Point Dr
- 72 Elgin Rd