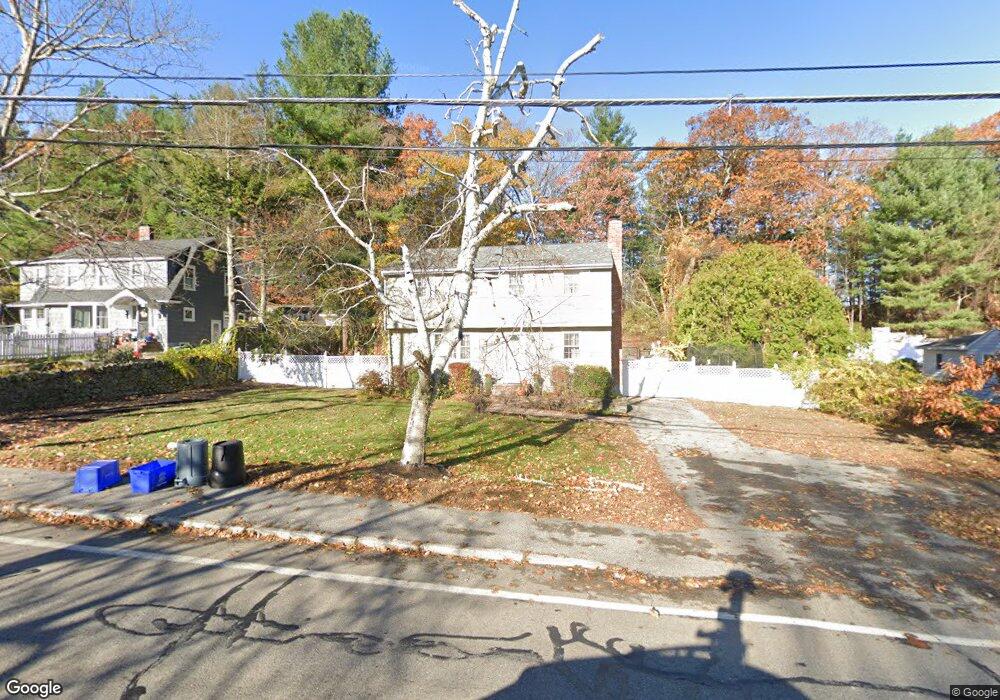
87 Lowell St Andover, MA 01810
Shawsheen Heights NeighborhoodEstimated Value: $774,000 - $852,000
4
Beds
2
Baths
2,100
Sq Ft
$392/Sq Ft
Est. Value
About This Home
This home is located at 87 Lowell St, Andover, MA 01810 and is currently estimated at $823,581, approximately $392 per square foot. 87 Lowell St is a home located in Essex County with nearby schools including West Elementary School, Andover West Middle School, and Andover High School.
Ownership History
Date
Name
Owned For
Owner Type
Purchase Details
Closed on
Jan 26, 2015
Sold by
Mansourian Sherri R
Bought by
Dibarri Sherri R and Dibarri Joseph N
Current Estimated Value
Purchase Details
Closed on
Nov 8, 2013
Sold by
Dibarri Joseph N and Mansourian Sherri R
Bought by
Mansourian Sherri R
Purchase Details
Closed on
Jul 31, 2002
Sold by
Nieves Maritza
Bought by
Dibarri Joseph N and Mansourian Sherri R
Home Financials for this Owner
Home Financials are based on the most recent Mortgage that was taken out on this home.
Original Mortgage
$361,750
Interest Rate
6.64%
Mortgage Type
Purchase Money Mortgage
Purchase Details
Closed on
May 2, 1990
Sold by
New Eng Design
Bought by
Nieves Maritza
Purchase Details
Closed on
Nov 1, 1988
Sold by
Roberge Conrad
Bought by
New Eng Design Bldg
Create a Home Valuation Report for This Property
The Home Valuation Report is an in-depth analysis detailing your home's value as well as a comparison with similar homes in the area
Home Values in the Area
Average Home Value in this Area
Purchase History
| Date | Buyer | Sale Price | Title Company |
|---|---|---|---|
| Dibarri Sherri R | -- | -- | |
| Dibarri Sherri R | -- | -- | |
| Mansourian Sherri R | -- | -- | |
| Mansourian Sherri R | -- | -- | |
| Dibarri Joseph N | $380,800 | -- | |
| Dibarri Joseph N | $380,800 | -- | |
| Nieves Maritza | $160,000 | -- | |
| Nieves Maritza | $160,000 | -- | |
| New Eng Design Bldg | $215,000 | -- |
Source: Public Records
Mortgage History
| Date | Status | Borrower | Loan Amount |
|---|---|---|---|
| Previous Owner | New Eng Design Bldg | $361,750 |
Source: Public Records
Tax History Compared to Growth
Tax History
| Year | Tax Paid | Tax Assessment Tax Assessment Total Assessment is a certain percentage of the fair market value that is determined by local assessors to be the total taxable value of land and additions on the property. | Land | Improvement |
|---|---|---|---|---|
| 2024 | $8,659 | $672,300 | $363,200 | $309,100 |
| 2023 | $8,398 | $614,800 | $336,300 | $278,500 |
| 2022 | $7,777 | $532,700 | $284,800 | $247,900 |
| 2021 | $7,439 | $486,500 | $259,000 | $227,500 |
| 2020 | $7,134 | $475,300 | $252,700 | $222,600 |
| 2019 | $7,075 | $463,300 | $245,300 | $218,000 |
| 2018 | $6,771 | $432,900 | $231,300 | $201,600 |
| 2017 | $6,500 | $428,200 | $226,800 | $201,400 |
| 2016 | $6,368 | $429,700 | $226,800 | $202,900 |
| 2015 | $6,147 | $410,600 | $218,000 | $192,600 |
Source: Public Records
Map
Nearby Homes
- 38 Lincoln Cir E
- 37 Crenshaw Ln Unit 37
- 10 Martingale Ln Unit 10
- 5 Castle Heights Rd
- 25 Clubview Dr Unit 25
- 13 Clubview Dr Unit 13
- 42 Stevens St
- 6 Windsor St
- 21 Clubview Dr Unit 21
- 2 Powder Mill Square Unit 2B
- 24 York St
- 20 Walnut Ave
- 156 High St
- 10 Maple Ave Unit 3
- Lot 7 Weeping Willow Dr
- 437 N Main St Unit C
- 102 Weare St
- 61 Elm St Unit 61
- 5 Marc Ln
- 96 Beacon St