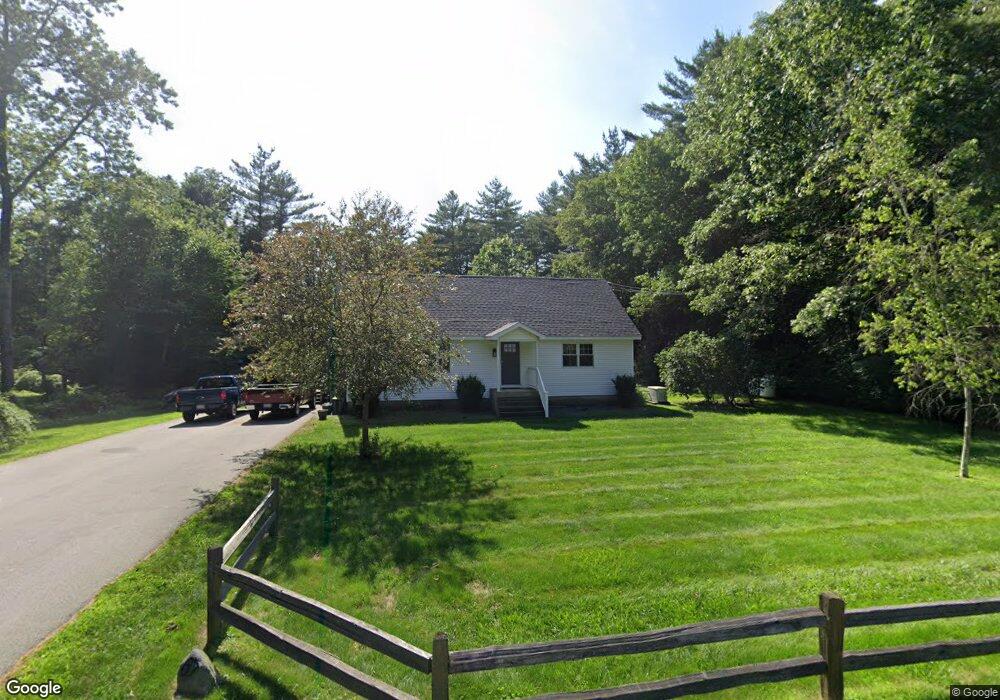
87 Merrifield Rd Bernardston, MA 01337
Estimated Value: $332,000 - $398,000
3
Beds
2
Baths
1,716
Sq Ft
$216/Sq Ft
Est. Value
About This Home
This home is located at 87 Merrifield Rd, Bernardston, MA 01337 and is currently estimated at $370,250, approximately $215 per square foot. 87 Merrifield Rd is a home located in Franklin County with nearby schools including Pioneer Valley Regional and Full Circle School.
Ownership History
Date
Name
Owned For
Owner Type
Purchase Details
Closed on
Mar 20, 2018
Sold by
Petersen Nicole M
Bought by
Petersen Mark C and Petersen Nicole M
Current Estimated Value
Purchase Details
Closed on
Jan 26, 2007
Sold by
Sheffield Lisa M
Bought by
Elie Nicole M
Home Financials for this Owner
Home Financials are based on the most recent Mortgage that was taken out on this home.
Original Mortgage
$231,000
Interest Rate
6.15%
Mortgage Type
Purchase Money Mortgage
Purchase Details
Closed on
May 29, 1992
Sold by
Heritage Bk Svgs
Bought by
Wyngowski Robert E and Sheffield Lisa M
Home Financials for this Owner
Home Financials are based on the most recent Mortgage that was taken out on this home.
Original Mortgage
$94,500
Interest Rate
8.7%
Mortgage Type
Purchase Money Mortgage
Create a Home Valuation Report for This Property
The Home Valuation Report is an in-depth analysis detailing your home's value as well as a comparison with similar homes in the area
Home Values in the Area
Average Home Value in this Area
Purchase History
| Date | Buyer | Sale Price | Title Company |
|---|---|---|---|
| Petersen Mark C | -- | -- | |
| Petersen Mark C | -- | -- | |
| Elie Nicole M | $231,000 | -- | |
| Elie Nicole M | $231,000 | -- | |
| Wyngowski Robert E | $105,000 | -- | |
| Wyngowski Robert E | $105,000 | -- |
Source: Public Records
Mortgage History
| Date | Status | Borrower | Loan Amount |
|---|---|---|---|
| Previous Owner | Elie Nicole M | $231,000 | |
| Previous Owner | Wyngowski Robert E | $94,500 |
Source: Public Records
Tax History Compared to Growth
Tax History
| Year | Tax Paid | Tax Assessment Tax Assessment Total Assessment is a certain percentage of the fair market value that is determined by local assessors to be the total taxable value of land and additions on the property. | Land | Improvement |
|---|---|---|---|---|
| 2025 | $4,538 | $318,000 | $46,800 | $271,200 |
| 2024 | $4,848 | $296,700 | $46,800 | $249,900 |
| 2023 | $5,272 | $329,700 | $47,400 | $282,300 |
| 2022 | $5,050 | $293,600 | $43,100 | $250,500 |
| 2021 | $4,622 | $248,900 | $36,600 | $212,300 |
| 2020 | $4,501 | $242,100 | $36,600 | $205,500 |
| 2019 | $4,399 | $224,000 | $36,600 | $187,400 |
| 2018 | $4,376 | $213,800 | $37,200 | $176,600 |
| 2017 | $4,126 | $208,600 | $37,200 | $171,400 |
| 2016 | $4,059 | $208,600 | $37,200 | $171,400 |
| 2015 | $3,995 | $215,000 | $43,700 | $171,300 |
Source: Public Records
Map
Nearby Homes
- 23 Industrial Dr
- 59 River St
- 1 Northfield Rd
- 47 Cross St
- 75 South St Unit 3
- 180 Bald Mountain Rd
- 539 Fox Hill Rd
- Lot 9 Fox Hill Rd (Off)
- 83 Eden Trail Branch
- 182 Main Rd
- 56 Brattleboro Rd
- 001 Adams Rd
- 31 Lovers Ln
- 0 Meadow View Ln & Pine Meadow
- 72 Meadowood Dr
- 696 Bernardston Rd
- 704 Brattleboro Rd
- 775 Brattleboro Rd
- 218 Greenfield Rd
- 30 Park St
- 1 Merrifield Rd
- Lot 4 Merrifield Rd
- Lot 1 Merrifield Rd
- 95 Merrifield Rd
- 83 Merrifield Rd
- 88 Merrifield Rd
- 99 Merrifield Rd
- 75 Merrifield Rd
- 107 Merrifield Rd
- 73 Merrifield Rd
- 110 Merrifield Rd
- 63 Merrifield Rd
- 115 Merrifield Rd
- 72 Merrifield Rd
- 125 Merrifield Rd
- 124 Merrifield Rd
- 56 Merrifield Rd
- 132 Merrifield Rd
- 60 Merrifield Rd
- 131 Merrifield Rd