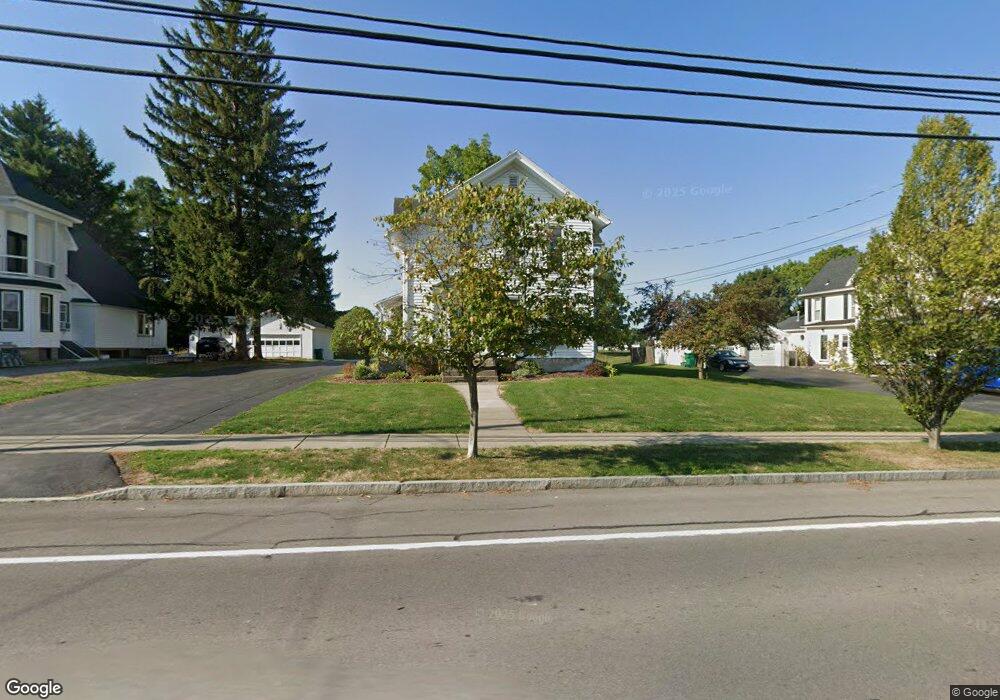
87 N Main St Oakfield, NY 14125
Estimated Value: $167,000 - $201,000
4
Beds
3
Baths
3,208
Sq Ft
$57/Sq Ft
Est. Value
About This Home
This home is located at 87 N Main St, Oakfield, NY 14125 and is currently estimated at $182,986, approximately $57 per square foot. 87 N Main St is a home with nearby schools including Oakfield-Alabama Elementary School, Oakfield-Alabama Middle/High School, and Genesee Christian Academy.
Ownership History
Date
Name
Owned For
Owner Type
Purchase Details
Closed on
Jun 2, 2025
Sold by
Belliveau Allen R
Bought by
Syren Properties Llc
Current Estimated Value
Purchase Details
Closed on
Aug 11, 2005
Sold by
Cianfrini Raymond F
Bought by
Belliveau Allen R
Home Financials for this Owner
Home Financials are based on the most recent Mortgage that was taken out on this home.
Original Mortgage
$76,000
Interest Rate
5.54%
Mortgage Type
Purchase Money Mortgage
Create a Home Valuation Report for This Property
The Home Valuation Report is an in-depth analysis detailing your home's value as well as a comparison with similar homes in the area
Home Values in the Area
Average Home Value in this Area
Purchase History
| Date | Buyer | Sale Price | Title Company |
|---|---|---|---|
| Syren Properties Llc | $180,000 | None Available | |
| Syren Properties Llc | $180,000 | None Available | |
| Belliveau Allen R | $95,000 | Thomas Williams | |
| Belliveau Allen R | $95,000 | Thomas Williams |
Source: Public Records
Mortgage History
| Date | Status | Borrower | Loan Amount |
|---|---|---|---|
| Previous Owner | Belliveau Allen R | $76,000 |
Source: Public Records
Tax History Compared to Growth
Tax History
| Year | Tax Paid | Tax Assessment Tax Assessment Total Assessment is a certain percentage of the fair market value that is determined by local assessors to be the total taxable value of land and additions on the property. | Land | Improvement |
|---|---|---|---|---|
| 2024 | $4,328 | $124,000 | $21,700 | $102,300 |
| 2023 | $4,332 | $120,000 | $21,700 | $98,300 |
| 2022 | $4,274 | $115,000 | $21,500 | $93,500 |
| 2021 | $4,289 | $109,300 | $21,500 | $87,800 |
| 2020 | $4,239 | $103,300 | $21,300 | $82,000 |
| 2019 | $4,152 | $101,300 | $21,300 | $80,000 |
| 2018 | $4,152 | $99,300 | $20,300 | $79,000 |
| 2017 | $4,129 | $99,300 | $20,300 | $79,000 |
| 2016 | $4,117 | $98,500 | $20,300 | $78,200 |
| 2015 | -- | $98,500 | $20,300 | $78,200 |
| 2014 | -- | $98,500 | $20,300 | $78,200 |
Source: Public Records
Map
Nearby Homes
- 18 Bennett Ave
- 34 Broadway St
- 43 Garibaldi Ave
- 10 Orchard St
- 6977 Lewiston Rd
- 6632 Albion Rd
- 3526 Galloway Rd
- 2180 Judge Rd
- 4106 Maltby Rd
- 3233 Rd Unit B
- 6440 Knowlesville Rd
- 6242 Knowlesville Rd
- 2651 Pratt Rd
- 36 Church St
- 0 0 Knowlesville Rd
- 20 S Main St
- 3644 W Main Street Rd
- 4559 W Saile Dr
- 201 Oak St
- 48 Redfield Pkwy