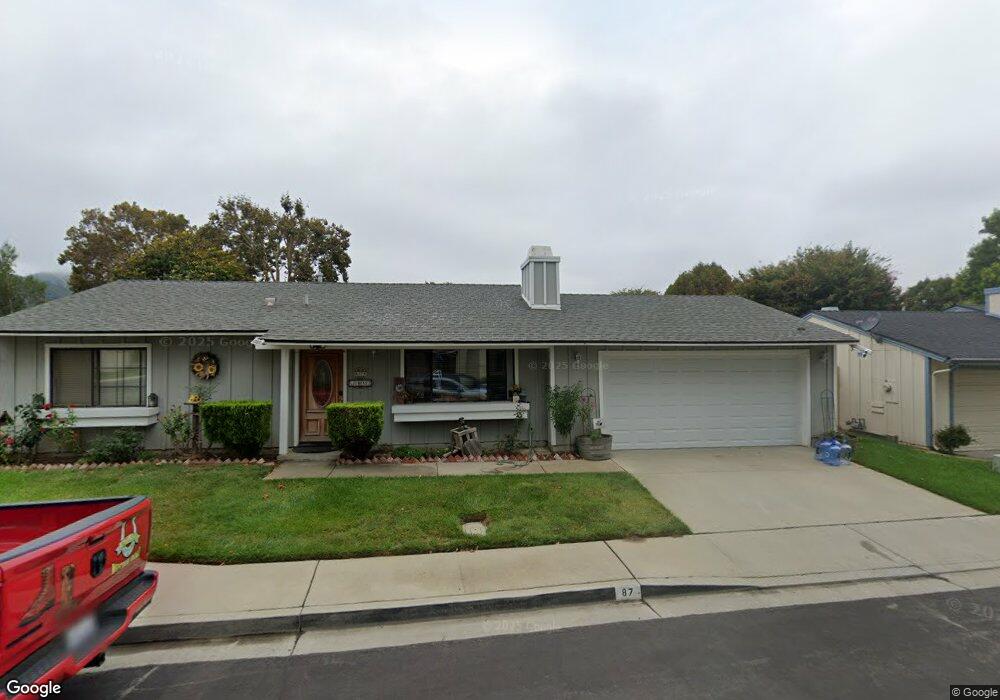
87 Six Flags Cir Unit 5 Buellton, CA 93427
Estimated Value: $707,550 - $815,000
3
Beds
2
Baths
1,101
Sq Ft
$710/Sq Ft
Est. Value
About This Home
This home is located at 87 Six Flags Cir Unit 5, Buellton, CA 93427 and is currently estimated at $781,388, approximately $709 per square foot. 87 Six Flags Cir Unit 5 is a home located in Santa Barbara County with nearby schools including Oak Valley Elementary School, Jonata Middle School, and Santa Ynez Valley Union High School.
Ownership History
Date
Name
Owned For
Owner Type
Purchase Details
Closed on
Mar 27, 2001
Sold by
Bastanchury Mark L and Bastanchury Diane M
Bought by
Jimenez Salvador and Jimenez Sonia A
Current Estimated Value
Home Financials for this Owner
Home Financials are based on the most recent Mortgage that was taken out on this home.
Original Mortgage
$213,600
Outstanding Balance
$78,976
Interest Rate
7.06%
Estimated Equity
$702,412
Purchase Details
Closed on
Jun 16, 1994
Sold by
Rodriguez Felipe
Bought by
Bastanchury Mark L and Bastanchupy Diane M
Home Financials for this Owner
Home Financials are based on the most recent Mortgage that was taken out on this home.
Original Mortgage
$150,000
Interest Rate
8.57%
Create a Home Valuation Report for This Property
The Home Valuation Report is an in-depth analysis detailing your home's value as well as a comparison with similar homes in the area
Home Values in the Area
Average Home Value in this Area
Purchase History
| Date | Buyer | Sale Price | Title Company |
|---|---|---|---|
| Jimenez Salvador | $267,000 | First American Title Co | |
| Bastanchury Mark L | $158,000 | Santa Barbara Title Co |
Source: Public Records
Mortgage History
| Date | Status | Borrower | Loan Amount |
|---|---|---|---|
| Open | Jimenez Salvador | $213,600 | |
| Previous Owner | Bastanchury Mark L | $150,000 | |
| Closed | Jimenez Salvador | $26,700 |
Source: Public Records
Tax History
| Year | Tax Paid | Tax Assessment Tax Assessment Total Assessment is a certain percentage of the fair market value that is determined by local assessors to be the total taxable value of land and additions on the property. | Land | Improvement |
|---|---|---|---|---|
| 2025 | $4,386 | $412,254 | $150,673 | $261,581 |
| 2023 | $4,386 | $396,247 | $144,823 | $251,424 |
| 2022 | $4,243 | $388,479 | $141,984 | $246,495 |
| 2021 | $4,173 | $380,862 | $139,200 | $241,662 |
| 2020 | $4,122 | $376,958 | $137,773 | $239,185 |
| 2019 | $4,050 | $369,568 | $135,072 | $234,496 |
| 2018 | $3,979 | $362,323 | $132,424 | $229,899 |
| 2017 | $3,910 | $355,220 | $129,828 | $225,392 |
| 2016 | $3,763 | $348,256 | $127,283 | $220,973 |
| 2014 | $3,647 | $336,308 | $122,917 | $213,391 |
Source: Public Records
Map
Nearby Homes
- 91 Six Flags Cir
- 201 Victory Dr Unit 3
- 80 Zaca St Unit Spc 15
- 80 Zaca St Unit 4
- 80 Zaca St Unit 26
- 330 W Highway 246 Unit 51
- 330 W Highway 246 Unit Spc 14
- 330 W Highway 246 Unit Spc 50
- 330 W Highway 246 Unit 17
- 1701 W Highway 246
- 536 Elkton Ln
- 330 W Highway 246 Unit 225
- 330 W Hwy 246 Unit 225
- 330 W Hwy 246 Unit 83
- 330 W Hwy 246 Unit 132
- 330 W Hwy 246 Unit 148
- 593 Avenue of Flags
- 546 Covelo Ln
- 593 Central Ave
- 348 Kendale Rd
- 19 Bear Creek Dr
- 89 Six Flags Cir
- 18 Bundy Cir
- 98 Six Flags Cir
- 29 Bear Creek Dr
- 85 Six Flags Cir
- 20 Bear Creek Dr Unit 5
- 100 Six Flags Cir
- 28 Bundy Cir
- 30 Bear Creek Dr
- 102 Six Flags Cir
- 39 Bear Creek Dr Unit 5
- 96 Six Flags Cir
- 38 Bundy Cir Unit 3
- 40 Bear Creek Dr
- 81 Six Flags Cir
- 83 Six Flags Cir
- 104 Six Flags Cir
- 17 Bundy Cir
- 79 Six Flags Cir
Your Personal Tour Guide
Ask me questions while you tour the home.