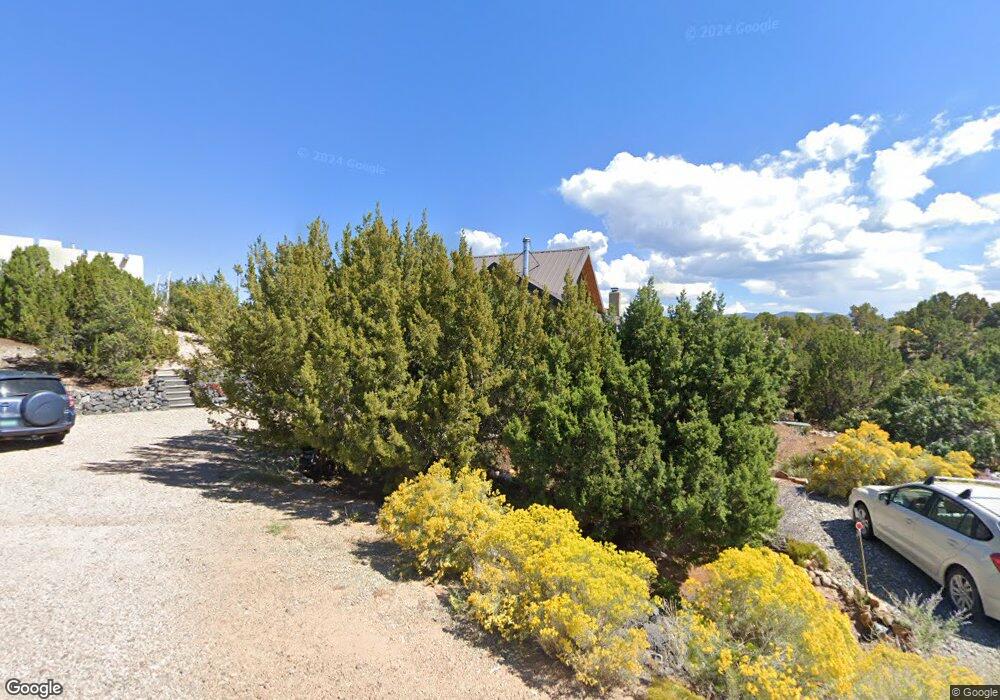
870 Camino Don Emilio Santa Fe, NM 87507
Estimated Value: $699,000 - $962,105
2
Beds
--
Bath
1,991
Sq Ft
$409/Sq Ft
Est. Value
About This Home
This home is located at 870 Camino Don Emilio, Santa Fe, NM 87507 and is currently estimated at $815,276, approximately $409 per square foot. 870 Camino Don Emilio is a home located in Santa Fe County with nearby schools including Aspen Community Magnet School, Capital High School, and Ms. Cohen's Homeschool Classroom.
Ownership History
Date
Name
Owned For
Owner Type
Purchase Details
Closed on
Mar 25, 2021
Sold by
Hood Jeffrey L
Bought by
Sanchez Rose
Current Estimated Value
Home Financials for this Owner
Home Financials are based on the most recent Mortgage that was taken out on this home.
Original Mortgage
$330,000
Outstanding Balance
$296,321
Interest Rate
2.8%
Mortgage Type
New Conventional
Estimated Equity
$518,955
Purchase Details
Closed on
Aug 17, 2009
Sold by
Hood Jeffrey L
Bought by
Hood Jeffery L and Sanchez Rose
Purchase Details
Closed on
Mar 3, 2006
Sold by
Brog Uomi S
Bought by
Hood Jeffrey L
Home Financials for this Owner
Home Financials are based on the most recent Mortgage that was taken out on this home.
Original Mortgage
$112,000
Interest Rate
6.05%
Mortgage Type
Credit Line Revolving
Purchase Details
Closed on
Feb 25, 2002
Sold by
Eco Logical Communities Inc
Bought by
Brog Uomi S
Create a Home Valuation Report for This Property
The Home Valuation Report is an in-depth analysis detailing your home's value as well as a comparison with similar homes in the area
Home Values in the Area
Average Home Value in this Area
Purchase History
| Date | Buyer | Sale Price | Title Company |
|---|---|---|---|
| Sanchez Rose | -- | Prima Title Llc | |
| Hood Jeffery L | -- | None Available | |
| Hood Jeffrey L | -- | First American Title Ins Co | |
| Brog Uomi S | -- | Territorial Abstract & Title |
Source: Public Records
Mortgage History
| Date | Status | Borrower | Loan Amount |
|---|---|---|---|
| Open | Sanchez Rose | $330,000 | |
| Previous Owner | Hood Jeffrey L | $112,000 |
Source: Public Records
Tax History Compared to Growth
Tax History
| Year | Tax Paid | Tax Assessment Tax Assessment Total Assessment is a certain percentage of the fair market value that is determined by local assessors to be the total taxable value of land and additions on the property. | Land | Improvement |
|---|---|---|---|---|
| 2024 | $3,533 | $511,159 | $101,355 | $409,804 |
| 2023 | $3,536 | $496,271 | $98,403 | $397,868 |
| 2022 | $3,488 | $481,817 | $95,537 | $386,280 |
| 2021 | $3,421 | $155,928 | $30,918 | $125,010 |
| 2020 | $3,345 | $151,387 | $30,918 | $120,469 |
| 2019 | $3,279 | $146,978 | $30,918 | $116,060 |
| 2018 | $3,194 | $142,697 | $41,666 | $101,031 |
| 2017 | $3,116 | $139,946 | $41,666 | $98,280 |
| 2016 | $2,925 | $135,871 | $41,667 | $94,204 |
| 2015 | $2,955 | $135,870 | $41,667 | $94,203 |
| 2014 | $3,105 | $146,214 | $41,625 | $104,589 |
Source: Public Records
Map
Nearby Homes
- 1304 Montoya Place
- 1407 Borrego Pass
- 2201 W Alameda St
- 2200 W Alameda St
- 944 Camino Oraibi
- 1113 Paseo Corazon Unit 203
- 272 Camino Tres Arroyos
- 1702 Watchpoint
- 1534 Calle Angelina
- 1705 Painted Sky
- 246 Camino Tres Arroyos
- 2441 Calle Linda
- 947 & 949 Acequia de Las Joyas
- 960 Acequia de Las Joyas
- 500 Camino Solano
- 2804 Isaiah Ln
- 965 Osage Ave
- 2239 Vuelta San Marcos
- 1141 Harrison Rd
- 506 Barela Ln
- 814 Camino Don Emilio
- 859 Camino Tres Arroyos
- 815A Camino Don Emilio
- 815 Camino Don Emilio
- 801 Camino Tres Arroyos
- 776 Camino Don Emilio
- 875 Camino Don Emilio
- 3401 Coyotillo Ct
- 2835C W Alameda St
- 3424 Via Janna
- 3402 Coyotillo Ct
- 0 Coyotillo
- 810 Camino Don Emilio
- 1023 Camino Don Emilio
- 2921 W Alameda St Unit C
- 2921 W Alameda St
- 2921 W Alameda St Unit A,B,C
- 705 Camino Don Emilio
- 3406 Via Brisa
- 909 Camino Tres Arroyos