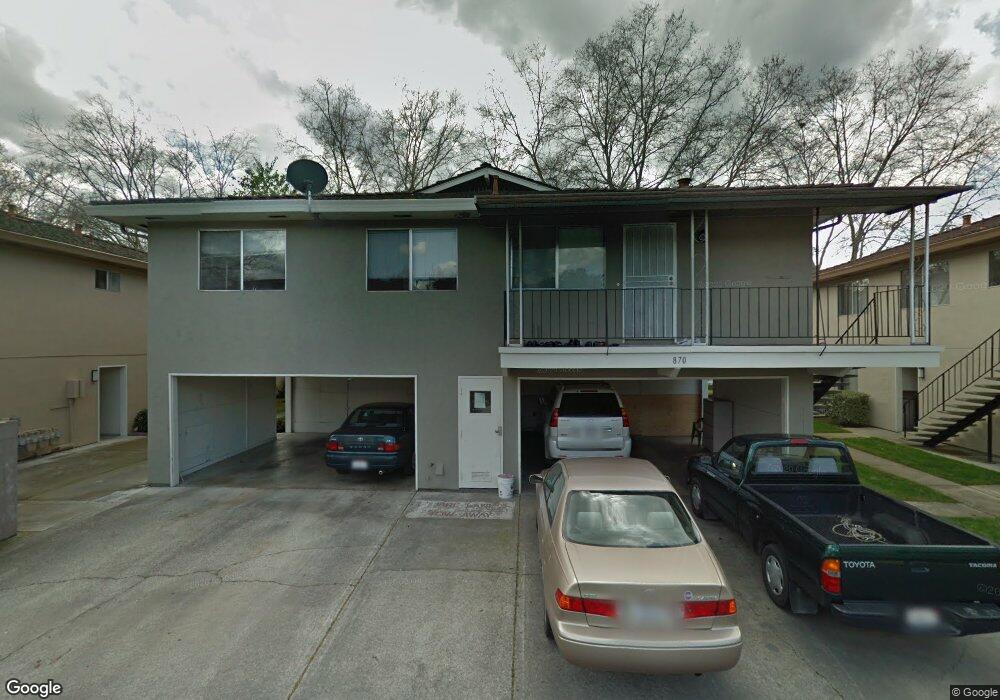
870 Gilchrist Walkway Unit 3 San Jose, CA 95133
Penitencia NeighborhoodEstimated Value: $482,546 - $570,000
2
Beds
1
Bath
903
Sq Ft
$582/Sq Ft
Est. Value
About This Home
This home is located at 870 Gilchrist Walkway Unit 3, San Jose, CA 95133 and is currently estimated at $525,637, approximately $582 per square foot. 870 Gilchrist Walkway Unit 3 is a home located in Santa Clara County with nearby schools including Summerdale Elementary School, Piedmont Middle School, and Independence High School.
Ownership History
Date
Name
Owned For
Owner Type
Purchase Details
Closed on
Nov 1, 2018
Sold by
Ngo Dennis Chan Binh and Vanwong Annie Van
Bought by
Ngo Dennis Chan Binh and Vanwong Annie Van
Current Estimated Value
Purchase Details
Closed on
Aug 8, 2011
Sold by
Ngo Donny Phi
Bought by
Ngo Dennis Chan Binh and Van Wong Annie
Purchase Details
Closed on
Mar 1, 2005
Sold by
Tran Adlai Xuan
Bought by
Ngo Donny Phi
Home Financials for this Owner
Home Financials are based on the most recent Mortgage that was taken out on this home.
Original Mortgage
$244,000
Interest Rate
1%
Mortgage Type
Negative Amortization
Purchase Details
Closed on
Feb 3, 1999
Sold by
Barbara Mikula
Bought by
Tran Adlai Xuan
Home Financials for this Owner
Home Financials are based on the most recent Mortgage that was taken out on this home.
Original Mortgage
$100,000
Interest Rate
6.79%
Mortgage Type
Stand Alone First
Purchase Details
Closed on
Nov 10, 1998
Sold by
Moore Patrick Kent
Bought by
Mikula Barbara
Create a Home Valuation Report for This Property
The Home Valuation Report is an in-depth analysis detailing your home's value as well as a comparison with similar homes in the area
Home Values in the Area
Average Home Value in this Area
Purchase History
| Date | Buyer | Sale Price | Title Company |
|---|---|---|---|
| Ngo Dennis Chan Binh | -- | None Available | |
| Ngo Dennis Chan Binh | $140,000 | Chicago Title Company | |
| Ngo Donny Phi | $305,000 | Fidelity National Title Ins | |
| Tran Adlai Xuan | $130,000 | Old Republic Title Company | |
| Mikula Barbara | -- | Old Republic Title Company |
Source: Public Records
Mortgage History
| Date | Status | Borrower | Loan Amount |
|---|---|---|---|
| Previous Owner | Ngo Donny Phi | $244,000 | |
| Previous Owner | Tran Adlai Xuan | $100,000 | |
| Closed | Ngo Donny Phi | $30,500 |
Source: Public Records
Tax History Compared to Growth
Tax History
| Year | Tax Paid | Tax Assessment Tax Assessment Total Assessment is a certain percentage of the fair market value that is determined by local assessors to be the total taxable value of land and additions on the property. | Land | Improvement |
|---|---|---|---|---|
| 2025 | $2,838 | $175,837 | $105,502 | $70,335 |
| 2024 | $2,838 | $172,390 | $103,434 | $68,956 |
| 2023 | $2,776 | $169,010 | $101,406 | $67,604 |
| 2022 | $2,776 | $165,697 | $99,418 | $66,279 |
| 2021 | $2,684 | $162,449 | $97,469 | $64,980 |
| 2020 | $2,628 | $160,784 | $96,470 | $64,314 |
| 2019 | $2,540 | $157,632 | $94,579 | $63,053 |
| 2018 | $2,507 | $154,542 | $92,725 | $61,817 |
| 2017 | $2,516 | $151,512 | $90,907 | $60,605 |
| 2016 | $2,405 | $148,542 | $89,125 | $59,417 |
| 2015 | $2,370 | $146,312 | $87,787 | $58,525 |
| 2014 | $2,234 | $143,447 | $86,068 | $57,379 |
Source: Public Records
Map
Nearby Homes
- 825 N Capitol Ave Unit 4
- 985 Harcot Ct
- 990 Harcot Ct
- 981 Harcot Ct
- 997 Harcot Ct
- 994 Harcot Ct
- 970 E Harcot Ct
- 982 Harcot Ct
- 998 Harcot Ct
- Residence 2 Plan at Ascend
- Residence 1 Plan at Ascend
- Residence 3 Plan at Ascend
- 2714 Mabury Square
- 714 N Capitol Ave
- 674 Galleon Ct
- 1055 N Capitol Ave Unit 124
- 1055 N Capitol Ave Unit 180
- 1055 N Capitol Ave Unit 51
- 709 Whitewater Ct Unit 44
- 2806 Glauser Dr
- 870 Gilchrist Walkway Unit 3
- 870 Gilchrist Dr Unit 3
- 870 Gilchrist Dr Unit 1
- 870 Gilchrist Dr Unit 2
- 870 Gilchrist Walkway Unit 4
- 870 Gilchrist Walkway Unit 1
- 862 Gilchrist Dr Unit 3
- 862 Gilchrist Walkway Unit 3
- 862 Gilchrist Walkway Unit 2
- 862 Gilchrist Walkway Unit 4
- 862 Gilchrist Walkway Unit 1
- 878 Gilchrist Walkway Unit 1
- 878 Gilchrist Walkway Unit 2
- 878 Gilchrist Walkway Unit 4
- 878 Gilchrist Walkway Unit 3
- 869 Gilchrist Dr Unit 4
- 869 Gilchrist Dr Unit 1
- 854 Gilchrist Walkway Unit 4
- 854 Gilchrist Walkway Unit 3