Estimated Value: $271,000 - $288,000
3
Beds
2
Baths
1,137
Sq Ft
$247/Sq Ft
Est. Value
About This Home
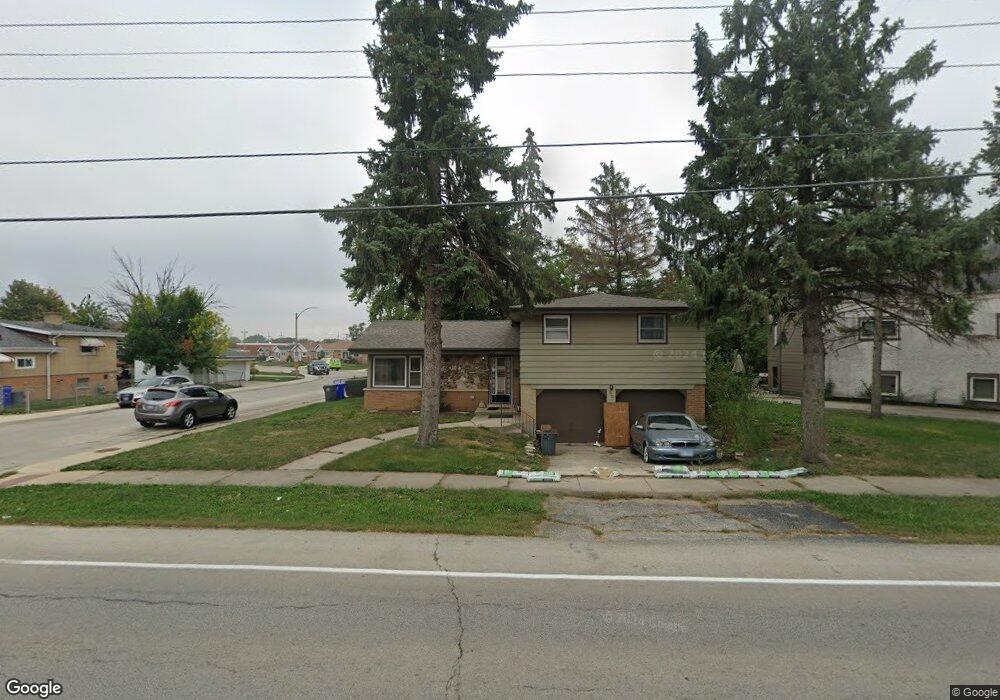
This home is located at 8701 Plainfield Rd, Lyons, IL 60534 and is currently estimated at $281,383, approximately $247 per square foot. 8701 Plainfield Rd is a home located in Cook County with nearby schools including Lincoln Elementary School, George Washington Middle School, and J. Sterling Morton High School West.
Ownership History
Date
Name
Owned For
Owner Type
Purchase Details
Closed on
May 1, 2024
Sold by
Torres Family Revocable Living Trust and Torres Leslie M
Bought by
Torres Family Revocable Living Trust and Torres
Current Estimated Value
Purchase Details
Closed on
Dec 30, 2008
Sold by
Ramirez Maria D and Torres Nicanor
Bought by
Torres Leslie M
Purchase Details
Closed on
May 17, 2004
Sold by
Ramirez Maria D
Bought by
Torres Nicanor and Ramirez Maria D
Home Financials for this Owner
Home Financials are based on the most recent Mortgage that was taken out on this home.
Original Mortgage
$135,000
Interest Rate
6.4%
Mortgage Type
Stand Alone Refi Refinance Of Original Loan
Purchase Details
Closed on
Jul 10, 2000
Sold by
Wozbut Thomas G and Wozbut Kathleen K
Bought by
Ramirez Maria D
Home Financials for this Owner
Home Financials are based on the most recent Mortgage that was taken out on this home.
Original Mortgage
$135,000
Interest Rate
8.27%
Mortgage Type
Stand Alone First
Create a Home Valuation Report for This Property
The Home Valuation Report is an in-depth analysis detailing your home's value as well as a comparison with similar homes in the area
Home Values in the Area
Average Home Value in this Area
Purchase History
| Date | Buyer | Sale Price | Title Company |
|---|---|---|---|
| Torres Family Revocable Living Trust | -- | None Listed On Document | |
| Torres Leslie M | -- | Multiple | |
| Torres Nicanor | -- | -- | |
| Ramirez Maria D | $135,000 | -- |
Source: Public Records
Mortgage History
| Date | Status | Borrower | Loan Amount |
|---|---|---|---|
| Previous Owner | Torres Nicanor | $135,000 | |
| Previous Owner | Ramirez Maria D | $135,000 |
Source: Public Records
Tax History
| Year | Tax Paid | Tax Assessment Tax Assessment Total Assessment is a certain percentage of the fair market value that is determined by local assessors to be the total taxable value of land and additions on the property. | Land | Improvement |
|---|---|---|---|---|
| 2025 | $6,956 | $23,000 | $3,716 | $19,284 |
| 2024 | $6,956 | $23,000 | $3,716 | $19,284 |
| 2023 | $6,314 | $23,000 | $3,716 | $19,284 |
| 2022 | $6,314 | $17,380 | $3,231 | $14,149 |
| 2021 | $5,985 | $17,380 | $3,231 | $14,149 |
| 2020 | $6,014 | $17,380 | $3,231 | $14,149 |
| 2019 | $6,434 | $16,711 | $2,907 | $13,804 |
| 2018 | $6,291 | $16,711 | $2,907 | $13,804 |
| 2017 | $6,055 | $16,711 | $2,907 | $13,804 |
| 2016 | $6,358 | $16,333 | $2,584 | $13,749 |
| 2015 | $6,218 | $16,333 | $2,584 | $13,749 |
| 2014 | $6,002 | $16,333 | $2,584 | $13,749 |
| 2013 | $6,271 | $18,417 | $2,584 | $15,833 |
Source: Public Records
Map
Nearby Homes
- 8625 43rd St
- 4247 Anna Ave
- 4218 Konrad Ave
- 8667 Plainfield Rd
- 8821 Congress Park Ave
- 8834 Plainfield Rd
- 4524 1st Ave
- 8803 Ogden Ave
- 4053 Rose Ave
- 4040 Rose Ave
- 4627 Custer Ave
- 8332 44th Place
- 8324 44th Place
- 8636 40th St
- 4239 Park Ave
- 4539 Clyde Ave
- 3901 Custer Ave
- 4448 Lawndale Ave
- 3845 Mccormick Ave
- 4608 Hawthorne Ave
- 8707 Plainfield Rd
- 8643 Plainfield Rd
- 8641 Lincoln Dr
- 8641 Plainfield Rd
- 8646 Lincoln Dr
- 8639 Lincoln Dr
- 8651 43rd St
- 8644 Lincoln Dr
- 8700 Plainfield Rd
- 8701 43rd St
- 8635 Lincoln Dr
- 8647 43rd St
- 8703 43rd St
- 8704 Plainfield Rd
- 8640 Lincoln Dr
- 8633 Lincoln Dr
- 8700 44th St
- 8643 43rd St
- 8656 44th St
- 8702 44th St
Your Personal Tour Guide
Ask me questions while you tour the home.