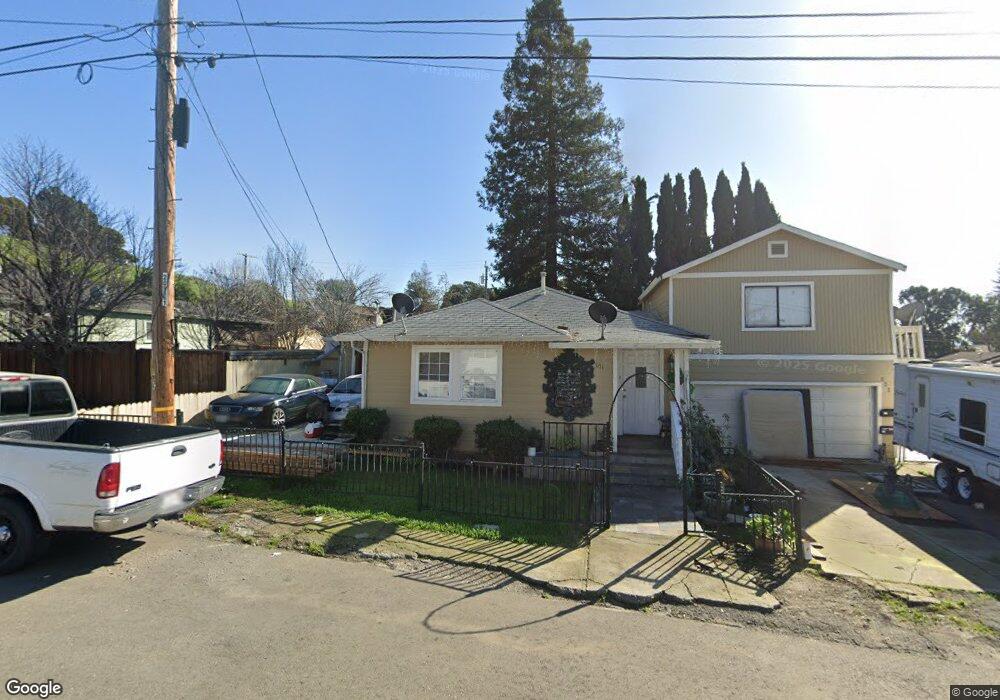
871 Broadway St Hayward, CA 94544
Mission-Garin NeighborhoodEstimated Value: $462,000 - $940,659
4
Beds
3
Baths
1,260
Sq Ft
$611/Sq Ft
Est. Value
About This Home
This home is located at 871 Broadway St, Hayward, CA 94544 and is currently estimated at $769,915, approximately $611 per square foot. 871 Broadway St is a home located in Alameda County with nearby schools including Tyrrell Elementary School, Cesar Chavez Middle School, and Tennyson High School.
Ownership History
Date
Name
Owned For
Owner Type
Purchase Details
Closed on
Jul 20, 2015
Sold by
Garcia Jaime
Bought by
Martinez Francisco J
Current Estimated Value
Purchase Details
Closed on
Mar 29, 2006
Sold by
Cesaretti Patricia M and Cesaretti Dino
Bought by
Garcia Jaime and Martinez Francisco J
Home Financials for this Owner
Home Financials are based on the most recent Mortgage that was taken out on this home.
Original Mortgage
$448,500
Interest Rate
7.75%
Mortgage Type
Balloon
Purchase Details
Closed on
Nov 9, 2005
Sold by
Cesaretti Dino
Bought by
Cesaretti Patricia M
Home Financials for this Owner
Home Financials are based on the most recent Mortgage that was taken out on this home.
Original Mortgage
$250,000
Interest Rate
7.95%
Mortgage Type
New Conventional
Purchase Details
Closed on
Jun 24, 2005
Sold by
Cesareti Patricia M and Nichols Patricia H
Bought by
Cesaretti Dino and Cesaretti Patricia M
Create a Home Valuation Report for This Property
The Home Valuation Report is an in-depth analysis detailing your home's value as well as a comparison with similar homes in the area
Home Values in the Area
Average Home Value in this Area
Purchase History
| Date | Buyer | Sale Price | Title Company |
|---|---|---|---|
| Martinez Francisco J | -- | None Available | |
| Garcia Jaime | $598,000 | Chicago Title Co | |
| Cesaretti Patricia M | -- | Alliance Title Company | |
| Cesaretti Dino | -- | Commonwealth Land |
Source: Public Records
Mortgage History
| Date | Status | Borrower | Loan Amount |
|---|---|---|---|
| Previous Owner | Garcia Jaime | $448,500 | |
| Previous Owner | Cesaretti Patricia M | $250,000 |
Source: Public Records
Tax History Compared to Growth
Tax History
| Year | Tax Paid | Tax Assessment Tax Assessment Total Assessment is a certain percentage of the fair market value that is determined by local assessors to be the total taxable value of land and additions on the property. | Land | Improvement |
|---|---|---|---|---|
| 2025 | $9,934 | $810,143 | $409,938 | $407,205 |
| 2024 | $9,934 | $794,122 | $401,901 | $399,221 |
| 2023 | $9,754 | $785,419 | $394,023 | $391,396 |
| 2022 | $9,560 | $763,020 | $386,298 | $383,722 |
| 2021 | $9,478 | $747,927 | $378,726 | $376,201 |
| 2020 | $8,805 | $700,000 | $200,000 | $500,000 |
| 2019 | $8,920 | $690,000 | $207,000 | $483,000 |
| 2018 | $8,350 | $675,000 | $202,500 | $472,500 |
| 2017 | $7,900 | $640,000 | $192,000 | $448,000 |
| 2016 | $7,172 | $600,000 | $180,000 | $420,000 |
| 2015 | $6,683 | $560,000 | $168,000 | $392,000 |
| 2014 | $6,140 | $530,000 | $159,000 | $371,000 |
Source: Public Records
Map
Nearby Homes
- 28030 E 10th St
- Plan 1 at Fusion - Townhomes
- Plan 5-Alt at Fusion - Live-Work Homes
- Plan 5 at Fusion - Live-Work Homes
- Plan 2 at Fusion - Townhomes
- Plan 3 at Fusion - Townhomes
- Plan 4 at Fusion - Townhomes
- 28967 Parkridge Loop Unit 91
- 806 Maybeck Place
- 803 Maybeck Place
- 28973 Parkridge Loop Unit 94
- Plan 3 at SoMi - HayPark
- Plan 2 at SoMi - HayPark
- Plan 1 at SoMi - HayPark
- Plan 4 at SoMi - HayPark
- 28942 Parkridge Loop Unit 108
- 28946 Parkridge Lp Unit 110
- 28949 Parkridge Loop Unit 86
- 850 Heaven Ct
- 28954 Parkwood Ln Unit 66
- 887 Broadway St
- 872 Douglas St
- 839 Broadway St
- 888 Douglas St
- 856 Douglas St
- 854 Broadway St
- 838 Broadway St
- 840 Douglas St
- 831 Broadway St
- 921 Broadway St
- 869 Kellogg Ave
- 873 Douglas St
- 27760 E 16th St
- 841 Douglas St
- 887 Douglas St
- 817 Broadway St
- 885 Kellogg Ave
- 27692 E 16th St
- 861 Kellogg Ave
- 822 Broadway St