871 Carlotta Ct Redlands, CA 92374
West Redlands NeighborhoodEstimated Value: $437,000 - $542,000
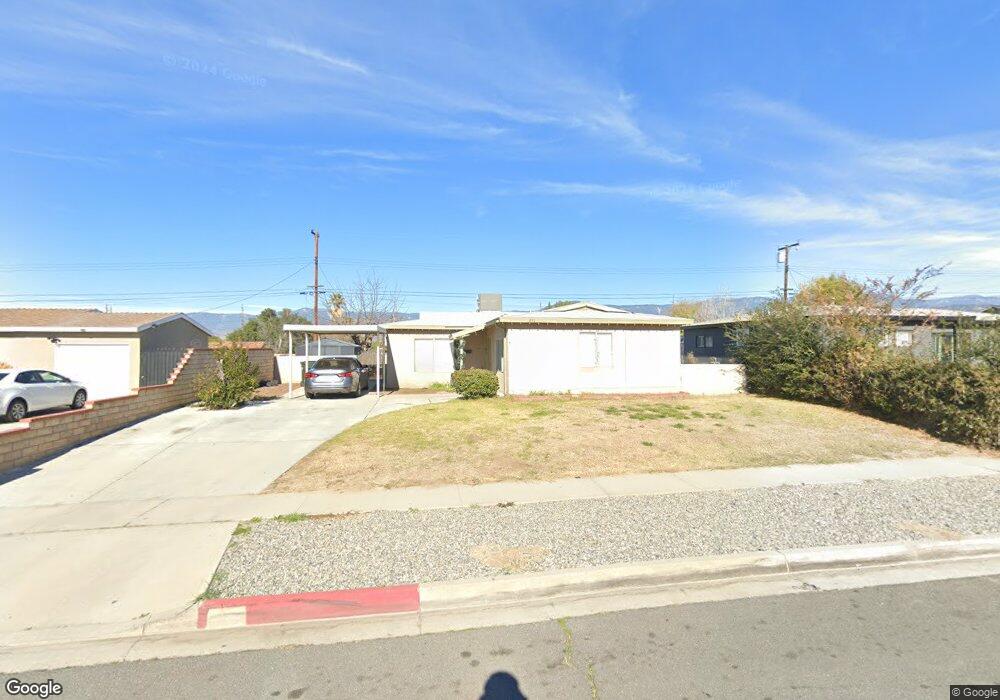
About This Home
This home is located at 871 Carlotta Ct, Redlands, CA 92374 and is currently estimated at $482,973, approximately $387 per square foot. 871 Carlotta Ct is a home located in San Bernardino County with nearby schools including Kingsbury Elementary School, Moore Middle School, and Citrus Valley High School.
Ownership History
We collect this data history from publicly available records. To have your information removed, we recommend requesting removal directly through your county’s website.
Purchase Details
Purchase Details
Home Financials for this Owner
Home Financials are based on the most recent Mortgage that was taken out on this home.Purchase Details
Home Financials for this Owner
Home Financials are based on the most recent Mortgage that was taken out on this home.Purchase Details
Home Values in the Area
Average Home Value in this Area
Purchase History
We collect this data history from publicly available records. To have your information removed, we recommend requesting removal directly through your county’s website.
| Date | Buyer | Sale Price | Title Company |
|---|---|---|---|
| -- | None Listed On Document | ||
| $225,000 | Linear Title Company Of Ca | ||
| -- | Lawyers Title Ie | ||
| -- | Lawyers Title Ie | ||
| -- | -- |
Mortgage History
We collect this data history from publicly available records. To have your information removed, we recommend requesting removal directly through your county’s website.
| Date | Status | Borrower | Loan Amount |
|---|---|---|---|
| Previous Owner | $105,604 | ||
| Previous Owner | $85,187 |
Tax History
We collect this data history from publicly available records. To have your information removed, we recommend requesting removal directly through your county’s website.
| Year | Tax Paid | Tax Assessment Tax Assessment Total Assessment is a certain percentage of the fair market value that is determined by local assessors to be the total taxable value of land and additions on the property. | Land | Improvement |
|---|---|---|---|---|
| 2025 | $4,236 | $346,490 | $103,142 | $243,348 |
| 2024 | $4,036 | $339,696 | $101,120 | $238,576 |
| 2023 | $2,991 | $246,071 | $73,275 | $172,796 |
| 2022 | $2,948 | $241,246 | $71,838 | $169,408 |
| 2021 | $3,001 | $236,515 | $70,429 | $166,086 |
| 2020 | $2,957 | $234,090 | $69,707 | $164,383 |
| 2019 | $2,874 | $229,500 | $68,340 | $161,160 |
| 2018 | $2,803 | $33,410 | $6,886 | $26,524 |
| 2017 | $452 | $32,755 | $6,751 | $26,004 |
| 2016 | $447 | $32,113 | $6,619 | $25,494 |
| 2015 | $444 | $31,631 | $6,520 | $25,111 |
| 2014 | $437 | $31,011 | $6,392 | $24,619 |
Map
- 887 Carlotta Ct
- 838 W Brockton Ave
- 831 W Lugonia Ave
- 1024 Lawton St
- 1132 Calhoun St
- 903 Webster St
- 215 W Lugonia Ave
- 1505 Canterbury Cir
- 1143 Orange St
- 1450 Washington St
- 186 N Center St
- 1704 Camellia Ln
- 163 N Center St
- 74 N Buena Vista St
- 833 Half Moon Ave
- 111 N Center St
- 606 Baldwin Ave
- 944 Half Moon Ave
- 323 E Colton Ave
- 1421 De Anza St
- 875 Carlotta Ct
- 867 Carlotta Ct
- 879 Carlotta Ct
- 863 Carlotta Ct
- 870 Carlotta Ct
- 874 Carlotta Ct
- 866 Carlotta Ct
- 883 Carlotta Ct
- 859 Carlotta Ct
- 878 Carlotta Ct
- 855 Carlotta Ct
- 882 Carlotta Ct
- 851 Carlotta Ct
- 820 Carlotta Ct
- 816 Carlotta Ct
- 824 Carlotta Ct
- 812 Carlotta Ct
- 847 Carlotta Ct
- 886 Carlotta Ct
- 808 Carlotta Ct
Ask me questions while you tour the home.