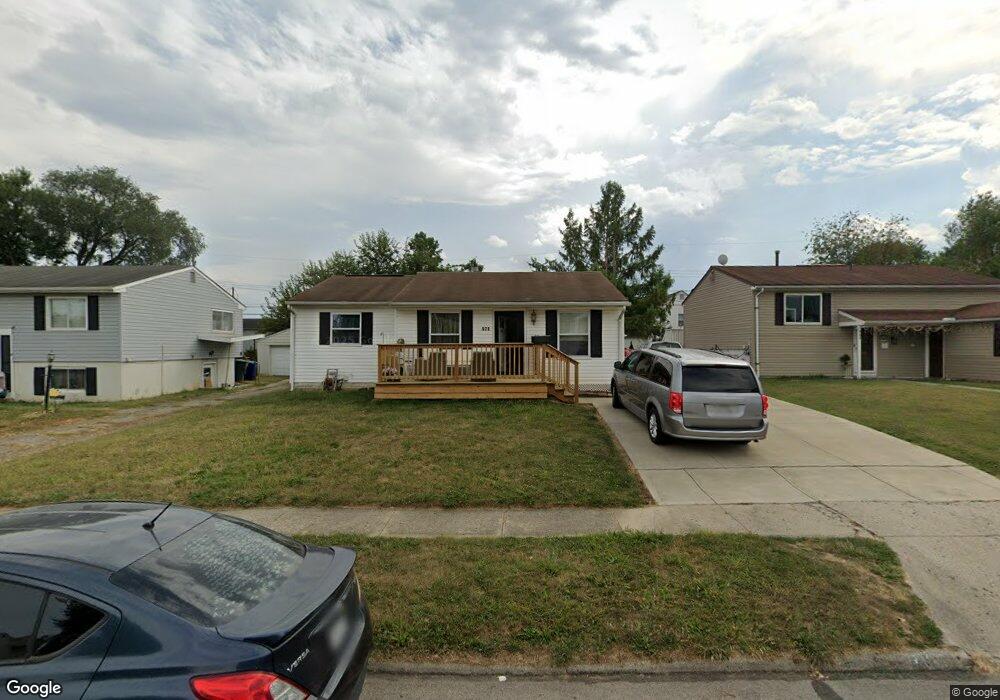
871 Higbee Dr S Columbus, OH 43207
Obetz-Lockbourne NeighborhoodEstimated Value: $174,000 - $253,000
3
Beds
1
Bath
1,240
Sq Ft
$164/Sq Ft
Est. Value
About This Home
This home is located at 871 Higbee Dr S, Columbus, OH 43207 and is currently estimated at $203,925, approximately $164 per square foot. 871 Higbee Dr S is a home located in Franklin County with nearby schools including Hamilton Elementary School, Hamilton Intermediate School, and Hamilton Middle School.
Ownership History
Date
Name
Owned For
Owner Type
Purchase Details
Closed on
Aug 12, 1987
Current Estimated Value
Create a Home Valuation Report for This Property
The Home Valuation Report is an in-depth analysis detailing your home's value as well as a comparison with similar homes in the area
Home Values in the Area
Average Home Value in this Area
Purchase History
| Date | Buyer | Sale Price | Title Company |
|---|---|---|---|
| -- | $47,500 | -- |
Source: Public Records
Tax History Compared to Growth
Tax History
| Year | Tax Paid | Tax Assessment Tax Assessment Total Assessment is a certain percentage of the fair market value that is determined by local assessors to be the total taxable value of land and additions on the property. | Land | Improvement |
|---|---|---|---|---|
| 2024 | $1,787 | $56,150 | $13,060 | $43,090 |
| 2023 | $1,782 | $56,150 | $13,060 | $43,090 |
| 2022 | $1,209 | $37,730 | $8,960 | $28,770 |
| 2021 | $1,230 | $37,730 | $8,960 | $28,770 |
| 2020 | $1,258 | $37,730 | $8,960 | $28,770 |
| 2019 | $1,096 | $31,790 | $7,460 | $24,330 |
| 2018 | $545 | $31,790 | $7,460 | $24,330 |
| 2017 | $1,097 | $31,790 | $7,460 | $24,330 |
| 2016 | $1,086 | $29,860 | $5,500 | $24,360 |
| 2015 | $550 | $29,860 | $5,500 | $24,360 |
| 2014 | $1,104 | $29,860 | $5,500 | $24,360 |
| 2013 | $578 | $31,430 | $5,775 | $25,655 |
Source: Public Records
Map
Nearby Homes
- 864 Robmeyer Dr
- 904 Kyle Ave
- 989 Lavender Ln
- 3573 S Champion Ave
- 3940 Hillman Rd W
- 965 Radbourne Dr
- 3735 Christie Rd W
- 1091 Vernon Dr
- 3691 Abney Rd
- 0 Williams Rd
- 812 Breathitt Ave
- 1101 Meadow Ln
- 1068 Tobi Dr
- 1118 Maplewood Rd
- 3691 Ferman Rd
- 696 Williams Rd
- 1085 Williams Rd
- 4207 Crosspointe Dr
- 4451 1/2 Lockbourne Rd Unit R
- 552 Harland Dr
- 865 Higbee Dr S
- 877 Higbee Dr S
- 857 Higbee Dr S
- 885 Higbee Dr S
- 834 Gulliver Dr
- 828 Gulliver Dr
- 846 Gulliver Dr
- 872 Higbee Dr S
- 866 Higbee Dr S
- 893 Higbee Dr S
- 851 Higbee Dr S
- 822 Gulliver Dr
- 878 Higbee Dr S
- 858 Higbee Dr S
- 852 Gulliver Dr
- 886 Higbee Dr S
- 852 Higbee Dr S
- 843 Higbee Dr S
- 901 Higbee Dr S
- 858 Gulliver Dr