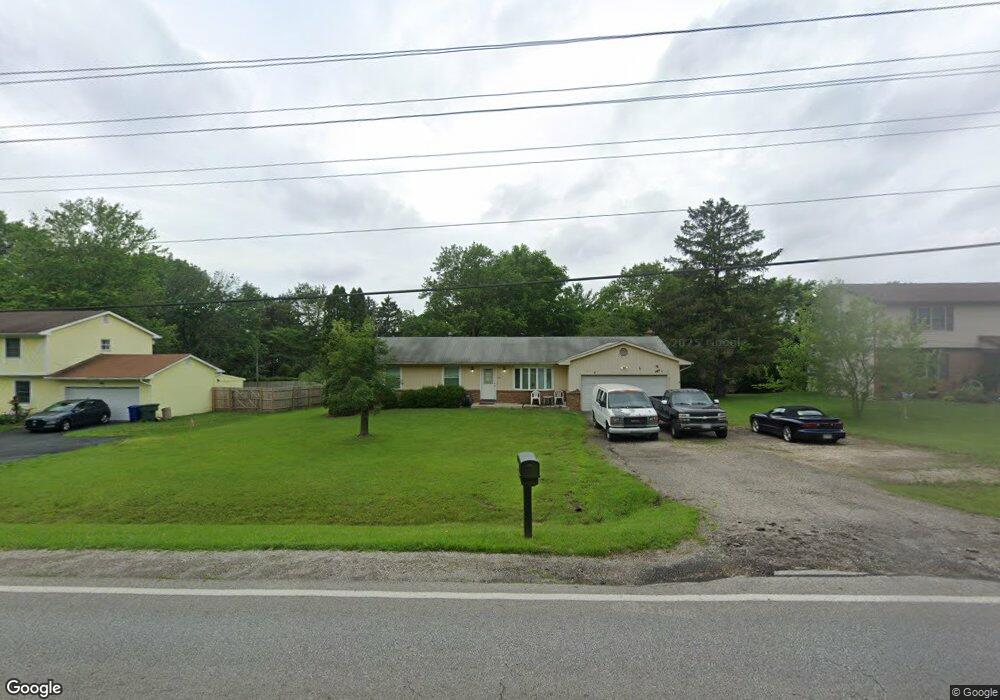
871 McNaughten Rd Columbus, OH 43213
Olde Orchard NeighborhoodEstimated Value: $295,000 - $320,000
3
Beds
3
Baths
1,464
Sq Ft
$207/Sq Ft
Est. Value
About This Home
This home is located at 871 McNaughten Rd, Columbus, OH 43213 and is currently estimated at $303,220, approximately $207 per square foot. 871 McNaughten Rd is a home located in Franklin County with nearby schools including Olde Orchard Elementary School, Sherwood Middle School, and Walnut Ridge High School.
Ownership History
Date
Name
Owned For
Owner Type
Purchase Details
Closed on
Dec 16, 2010
Sold by
Anderson Theodore V and Anderson Patricia A
Bought by
Hedlund Joseph E
Current Estimated Value
Home Financials for this Owner
Home Financials are based on the most recent Mortgage that was taken out on this home.
Original Mortgage
$81,251
Outstanding Balance
$55,110
Interest Rate
4.75%
Mortgage Type
FHA
Estimated Equity
$248,110
Purchase Details
Closed on
Aug 23, 2004
Sold by
Anderson Theodore V and Anderson Patricia A
Bought by
Anderson Theodore V and Anderson Patricia A
Home Financials for this Owner
Home Financials are based on the most recent Mortgage that was taken out on this home.
Original Mortgage
$144,500
Interest Rate
7%
Mortgage Type
Purchase Money Mortgage
Purchase Details
Closed on
Jun 27, 2003
Sold by
Anderson Theodore V and Anderson Patricia A
Bought by
Clayton Patricia
Purchase Details
Closed on
May 23, 1979
Bought by
Anderson Theodore
Create a Home Valuation Report for This Property
The Home Valuation Report is an in-depth analysis detailing your home's value as well as a comparison with similar homes in the area
Home Values in the Area
Average Home Value in this Area
Purchase History
| Date | Buyer | Sale Price | Title Company |
|---|---|---|---|
| Hedlund Joseph E | $50,000 | Transcounty | |
| Anderson Theodore V | -- | Professiona | |
| Clayton Patricia | -- | Stewart Title Agency Of Colu | |
| Anderson Theodore | -- | -- |
Source: Public Records
Mortgage History
| Date | Status | Borrower | Loan Amount |
|---|---|---|---|
| Open | Hedlund Joseph E | $81,251 | |
| Previous Owner | Anderson Theodore V | $144,500 |
Source: Public Records
Tax History Compared to Growth
Tax History
| Year | Tax Paid | Tax Assessment Tax Assessment Total Assessment is a certain percentage of the fair market value that is determined by local assessors to be the total taxable value of land and additions on the property. | Land | Improvement |
|---|---|---|---|---|
| 2024 | $4,235 | $94,360 | $31,290 | $63,070 |
| 2023 | $4,181 | $94,360 | $31,290 | $63,070 |
| 2022 | $3,299 | $63,600 | $35,740 | $27,860 |
| 2021 | $3,304 | $63,600 | $35,740 | $27,860 |
| 2020 | $3,309 | $63,600 | $35,740 | $27,860 |
| 2019 | $3,300 | $54,390 | $31,080 | $23,310 |
| 2018 | $2,870 | $54,390 | $31,080 | $23,310 |
| 2017 | $2,997 | $54,390 | $31,080 | $23,310 |
| 2016 | $2,697 | $40,710 | $9,000 | $31,710 |
| 2015 | $2,448 | $40,710 | $9,000 | $31,710 |
| 2014 | $2,454 | $40,710 | $9,000 | $31,710 |
| 2013 | $1,274 | $42,840 | $9,450 | $33,390 |
Source: Public Records
Map
Nearby Homes
- 807 McNaughten Rd
- 856 Cummington Rd
- 6231 Peach Tree Rd
- 6258 Peach Tree Rd
- 834 Persimmon Place
- 6040 Naughten Pond Dr
- 6052 Naughten Pond Dr
- 6056 Naughten Pond Dr
- Oxford Plan at Icon Villas at McNaughten
- Ashton Plan at Icon Villas at McNaughten
- 557 Woodingham Place Unit 1A
- 6279 Braiden Ct Unit 10B
- 541 Woodingham Place Unit 2-C
- 6033 McNaughten Grove Ln
- 6483 Borr Ave
- 6495 Balsam Dr
- 1314 Yorkland Rd Unit C
- 6526 Borr Ave
- 6626 Red Fox Rd
- 5789 Riverton Rd
- 857 McNaughten Rd
- 897 McNaughten Rd
- 860 Critchfield Rd
- 844 Critchfield Rd
- 872 Critchfield Rd
- 6020 Cranberry Ct
- 886 Critchfield Rd
- 868 McNaughten Rd
- 833 McNaughten Rd
- 5990 Effingham Rd
- 5976 Effingham Rd
- 850 McNaughten Rd
- 6025 Cranberry Ct
- 820 Critchfield Rd
- 825 McNaughten Rd
- 904 Critchfield Rd
- 6050 Cranberry Ct
- 853 Critchfield Rd
- 832 McNaughten Rd