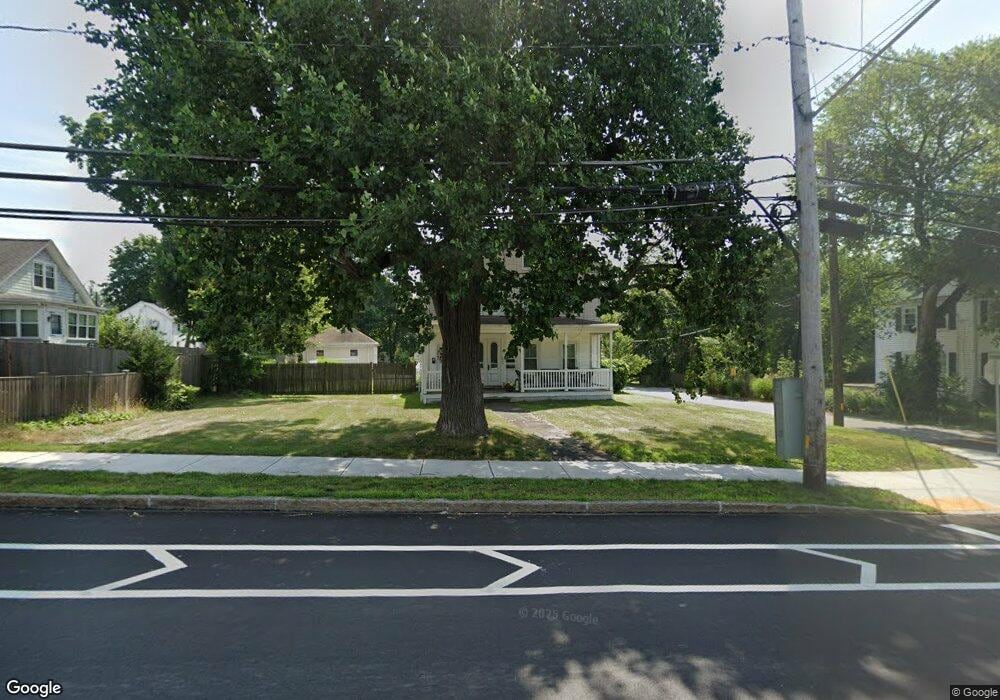
872 Main St Walpole, MA 02081
Estimated Value: $778,000 - $863,000
4
Beds
4
Baths
2,766
Sq Ft
$297/Sq Ft
Est. Value
About This Home
This home is located at 872 Main St, Walpole, MA 02081 and is currently estimated at $820,500, approximately $296 per square foot. 872 Main St is a home located in Norfolk County with nearby schools including Fisher School, Walpole Middle School, and Walpole High School.
Ownership History
Date
Name
Owned For
Owner Type
Purchase Details
Closed on
Apr 9, 2019
Sold by
Lynch Michael A
Bought by
Michael A Lynch Irt
Current Estimated Value
Purchase Details
Closed on
Apr 4, 2005
Sold by
Black Sheep Rt
Bought by
Lynch Michael A
Home Financials for this Owner
Home Financials are based on the most recent Mortgage that was taken out on this home.
Original Mortgage
$400,000
Interest Rate
5.61%
Mortgage Type
Purchase Money Mortgage
Create a Home Valuation Report for This Property
The Home Valuation Report is an in-depth analysis detailing your home's value as well as a comparison with similar homes in the area
Home Values in the Area
Average Home Value in this Area
Purchase History
| Date | Buyer | Sale Price | Title Company |
|---|---|---|---|
| Michael A Lynch Irt | -- | -- | |
| Lynch Michael A | -- | -- |
Source: Public Records
Mortgage History
| Date | Status | Borrower | Loan Amount |
|---|---|---|---|
| Previous Owner | Lynch Michael A | $400,000 |
Source: Public Records
Tax History Compared to Growth
Tax History
| Year | Tax Paid | Tax Assessment Tax Assessment Total Assessment is a certain percentage of the fair market value that is determined by local assessors to be the total taxable value of land and additions on the property. | Land | Improvement |
|---|---|---|---|---|
| 2025 | $8,960 | $698,400 | $292,900 | $405,500 |
| 2024 | $9,073 | $686,300 | $281,600 | $404,700 |
| 2023 | $8,991 | $647,300 | $244,900 | $402,400 |
| 2022 | $8,345 | $577,100 | $226,800 | $350,300 |
| 2021 | $7,852 | $529,100 | $213,900 | $315,200 |
| 2020 | $7,383 | $492,500 | $201,800 | $290,700 |
| 2019 | $6,824 | $451,900 | $194,100 | $257,800 |
| 2018 | $6,707 | $439,200 | $187,200 | $252,000 |
| 2017 | $6,540 | $426,600 | $180,000 | $246,600 |
| 2016 | $6,184 | $397,400 | $173,000 | $224,400 |
| 2015 | $6,015 | $383,100 | $164,800 | $218,300 |
| 2014 | $5,774 | $366,400 | $164,800 | $201,600 |
Source: Public Records
Map
Nearby Homes
- 224 School St Unit 10
- 4403 Pennington Dr Unit 4403
- 21 Spear Ave
- 634 Main St Unit 14
- 103 Centre Ln
- 305 Centre Ln
- 8 Rainbow Pond Dr Unit 8
- 24 Pelican Dr
- 145 South St Unit 5
- 145 South St Unit 19
- 8 Autumn Ln
- 18 Teal Cir
- 291 Plimpton St
- 66 Oak St
- 66 Gould St
- 127 Clear Pond Dr
- 137 Clear Pond Dr
- 52 Baker St
- 16 Magpie Cir Unit 16
- 2 Alexandra Way
- 864 Main St
- 11 Hanson Ave
- 30 Maple St
- 878 Main St
- 29 Maple St
- 21 Hanson Ave
- 6 Hanson Ave
- 869 Main St Unit 5,7
- 869 Main St
- 14 Hanson Ave
- 892 Main St
- 881 Main St Unit 18
- 881 Main St Unit 17
- 881 Main St Unit 16
- 881 Main St Unit 15
- 881 Main St Unit 14
- 881 Main St Unit 13
- 881 Main St Unit 12
- 881 Main St Unit 11
- 881 Main St Unit 10