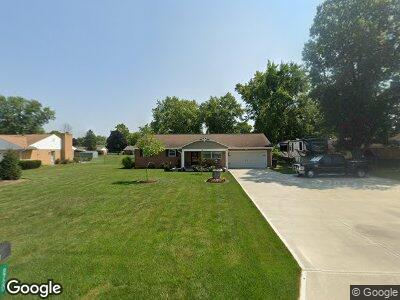
8720 Martz Paulin Rd Franklin, OH 45005
Estimated Value: $228,402 - $257,000
3
Beds
2
Baths
1,364
Sq Ft
$177/Sq Ft
Est. Value
About This Home
This home is located at 8720 Martz Paulin Rd, Franklin, OH 45005 and is currently estimated at $240,851, approximately $176 per square foot. 8720 Martz Paulin Rd is a home located in Warren County with nearby schools including Alden R Brown Elementary School, Chamberlain Middle School, and Carlisle High School.
Ownership History
Date
Name
Owned For
Owner Type
Purchase Details
Closed on
Aug 30, 2005
Sold by
Tipton James F
Bought by
Wilson Glenn A and Wilson Julie A
Current Estimated Value
Home Financials for this Owner
Home Financials are based on the most recent Mortgage that was taken out on this home.
Original Mortgage
$96,750
Interest Rate
5.82%
Mortgage Type
Fannie Mae Freddie Mac
Purchase Details
Closed on
Nov 19, 2003
Sold by
Dalton Glenath A
Bought by
Tipton James F
Purchase Details
Closed on
Sep 29, 1997
Sold by
Porter Albert A
Bought by
Tipton James F and Dalton Glenath A
Home Financials for this Owner
Home Financials are based on the most recent Mortgage that was taken out on this home.
Original Mortgage
$20,000
Interest Rate
7.63%
Mortgage Type
New Conventional
Create a Home Valuation Report for This Property
The Home Valuation Report is an in-depth analysis detailing your home's value as well as a comparison with similar homes in the area
Home Values in the Area
Average Home Value in this Area
Purchase History
| Date | Buyer | Sale Price | Title Company |
|---|---|---|---|
| Wilson Glenn A | $129,000 | Title Wave Agency | |
| Tipton James F | $6,000 | -- | |
| Tipton James F | $98,500 | -- |
Source: Public Records
Mortgage History
| Date | Status | Borrower | Loan Amount |
|---|---|---|---|
| Open | Wilson Glenn A | $20,000 | |
| Open | Wilson Glenn | $93,000 | |
| Closed | Wilson Glenn | $96,000 | |
| Closed | Wilson Glenn A | $96,750 | |
| Closed | Wilson Glenn A | $32,250 | |
| Closed | Tipton James F | $50,000 | |
| Previous Owner | Tipton James F | $20,000 |
Source: Public Records
Tax History Compared to Growth
Tax History
| Year | Tax Paid | Tax Assessment Tax Assessment Total Assessment is a certain percentage of the fair market value that is determined by local assessors to be the total taxable value of land and additions on the property. | Land | Improvement |
|---|---|---|---|---|
| 2024 | $2,618 | $68,100 | $17,850 | $50,250 |
| 2023 | $2,073 | $49,661 | $11,151 | $38,510 |
| 2022 | $2,062 | $49,662 | $11,151 | $38,511 |
| 2021 | $1,990 | $49,662 | $11,151 | $38,511 |
| 2020 | $1,930 | $42,088 | $9,450 | $32,638 |
| 2019 | $1,956 | $42,088 | $9,450 | $32,638 |
| 2018 | $1,960 | $42,088 | $9,450 | $32,638 |
| 2017 | $1,822 | $36,173 | $8,250 | $27,923 |
| 2016 | $1,587 | $36,173 | $8,250 | $27,923 |
| 2015 | $1,591 | $36,173 | $8,250 | $27,923 |
| 2014 | $1,561 | $35,120 | $8,010 | $27,110 |
| 2013 | $1,522 | $46,050 | $10,500 | $35,550 |
Source: Public Records
Map
Nearby Homes
- 8565 Starling Cir
- 8588 Twincreek Dr
- 6509 Junior Ct
- 120 Cousins Dr
- 5506 Glen Ct
- 1070 Dubois Rd
- 533 Clay St
- 1227 Waterbury Dr
- 1213 Waterbury Dr
- 1223 Waterbury Dr
- 1605 Ashbury Ct
- 10 Timber Creek Ct
- 30 Timber Creek Dr
- 732 Central Ave
- 7702 Gayle Dr
- 20 Timber Creek Dr
- 1019 Marty Lee Ln
- 9056 Leichty St
- 7901 Timberview Ct
- 1320 Ellington Ct
- 8720 Martz Paulin Rd
- 8738 Martz Paulin Rd
- 7672 Wren Dr
- 8681 Meadowlark Dr
- 8754 Martz Paulin Rd
- 8699 Meadowlark Dr
- 7632 Wren Dr
- 8721 Martz Paulin Rd
- 7671 Wren Dr
- 8705 Martz Paulin Rd
- 8737 Martz Paulin Rd
- 8717 Meadowlark Dr
- 7631 Wren Dr
- 8751 Martz Paulin Rd
- 8741 Meadowlark Dr
- 8660 Martz Paulin Rd
- 8675 Martz Paulin Rd
- 8767 Martz Paulin Rd
- 8583 Starling Cir
- 8786 Martz Paulin Rd