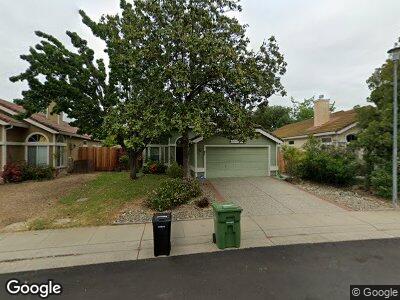
8721 Lewie Way Elk Grove, CA 95758
North West Elk Grove NeighborhoodEstimated Value: $461,000 - $520,000
3
Beds
2
Baths
1,310
Sq Ft
$373/Sq Ft
Est. Value
About This Home
This home is located at 8721 Lewie Way, Elk Grove, CA 95758 and is currently estimated at $489,166, approximately $373 per square foot. 8721 Lewie Way is a home located in Sacramento County with nearby schools including Marion Mix Elementary School, Harriet G. Eddy Middle School, and Laguna Creek High School.
Ownership History
Date
Name
Owned For
Owner Type
Purchase Details
Closed on
Mar 25, 2011
Sold by
Waterstone Securities Inc
Bought by
Luu Anhtuan and Dang Vivian
Current Estimated Value
Purchase Details
Closed on
Mar 23, 2011
Sold by
Smith Troy A
Bought by
Waterstone Securities Inc
Purchase Details
Closed on
Jan 30, 2008
Sold by
Smith Troy A
Bought by
Smith Troy A
Home Financials for this Owner
Home Financials are based on the most recent Mortgage that was taken out on this home.
Original Mortgage
$228,000
Interest Rate
6.17%
Mortgage Type
New Conventional
Purchase Details
Closed on
Sep 25, 2006
Sold by
Smith Troy A and Smith Patti A
Bought by
Smith Troy A
Home Financials for this Owner
Home Financials are based on the most recent Mortgage that was taken out on this home.
Original Mortgage
$200,000
Interest Rate
6.62%
Mortgage Type
Purchase Money Mortgage
Create a Home Valuation Report for This Property
The Home Valuation Report is an in-depth analysis detailing your home's value as well as a comparison with similar homes in the area
Home Values in the Area
Average Home Value in this Area
Purchase History
| Date | Buyer | Sale Price | Title Company |
|---|---|---|---|
| Luu Anhtuan | $155,000 | Fidelity National Title Co | |
| Waterstone Securities Inc | $119,300 | None Available | |
| Smith Troy A | -- | Fidelity National Title Co | |
| Smith Troy A | -- | First American Title Ins Co |
Source: Public Records
Mortgage History
| Date | Status | Borrower | Loan Amount |
|---|---|---|---|
| Previous Owner | Smith Troy A | $228,000 | |
| Previous Owner | Smith Troy A | $200,000 | |
| Previous Owner | Smith Troy A | $200,000 | |
| Previous Owner | Smith Troy A | $15,000 | |
| Previous Owner | Smith Troy A | $165,000 | |
| Previous Owner | Smith Troy A | $50,000 | |
| Previous Owner | Smith Troy A | $120,600 |
Source: Public Records
Tax History Compared to Growth
Tax History
| Year | Tax Paid | Tax Assessment Tax Assessment Total Assessment is a certain percentage of the fair market value that is determined by local assessors to be the total taxable value of land and additions on the property. | Land | Improvement |
|---|---|---|---|---|
| 2024 | $2,561 | $194,677 | $75,358 | $119,319 |
| 2023 | $2,488 | $190,861 | $73,881 | $116,980 |
| 2022 | $2,449 | $187,120 | $72,433 | $114,687 |
| 2021 | $2,394 | $183,452 | $71,013 | $112,439 |
| 2020 | $2,358 | $181,572 | $70,285 | $111,287 |
| 2019 | $2,313 | $178,012 | $68,907 | $109,105 |
| 2018 | $2,253 | $174,522 | $67,556 | $106,966 |
| 2017 | $2,209 | $171,101 | $66,232 | $104,869 |
| 2016 | $2,115 | $167,747 | $64,934 | $102,813 |
| 2015 | $2,073 | $165,228 | $63,959 | $101,269 |
| 2014 | $2,049 | $161,993 | $62,707 | $99,286 |
Source: Public Records
Map
Nearby Homes
- 5528 Deepdale Way
- 5126 Pleasantglen Way
- 8587 Gibbs Way
- 5920 Silver Shadow Cir
- 130 Cinema St
- 5279 Jacinto Ave
- 5984 Sawyer Cir
- 8490 Coeburn St
- 10 Newland Ct
- 5521 Rightwood Way
- 5924 Sawyer Cir
- 9004 Beryl Creek Way
- 304 Cinema St
- 8825 Kepler Ct
- 8 Crumpet Ct
- 15 Hallwood Ct
- 6009 Villa Rosa Way
- 9005 Chaff Ct
- 5550 Crystal Hill Way
- 8856 Westside Way
- 8721 Lewie Way
- 8725 Lewie Way
- 8717 Lewie Way
- 8729 Lewie Way
- 5300 Harvest Moon Ct
- 5218 Lake Pleasant Dr
- 5222 Lake Pleasant Dr
- 5301 Harvest Moon Ct
- 8722 Lewie Way
- 5304 Harvest Moon Ct
- 5226 Lake Pleasant Dr
- 8718 Lewie Way
- 8726 Lewie Way
- 5225 Stoney Creek Way
- 5300 Lake Pleasant Dr
- 8714 Lewie Way
- 5229 Stoney Creek Way
- 8730 Lewie Way
- 5308 Harvest Moon Ct
- 5233 Stoney Creek Way