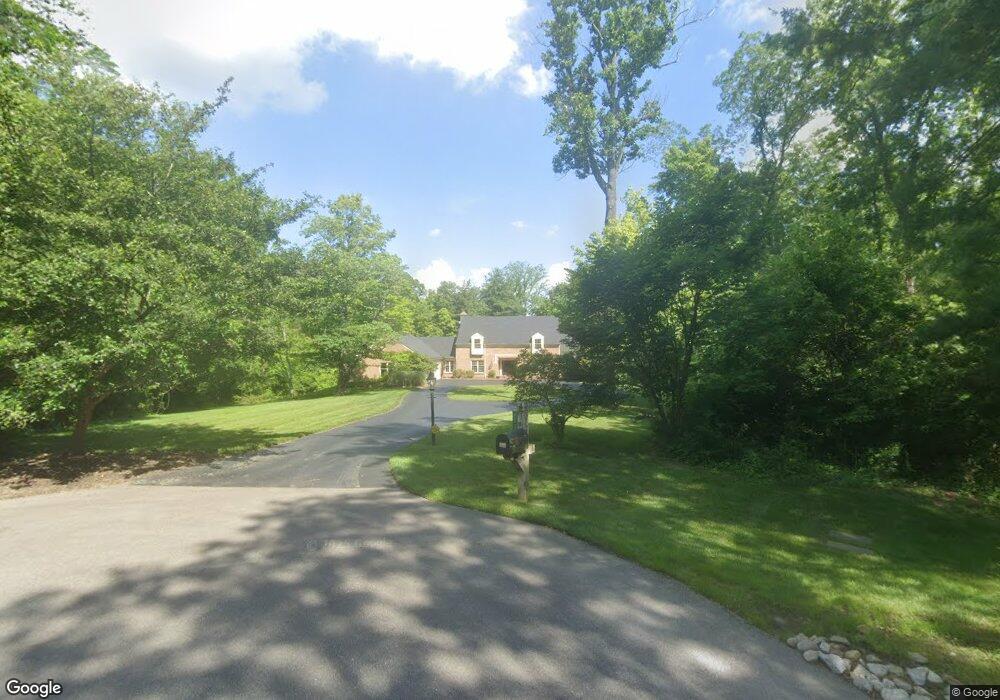
8725 Deeprun Ln Cincinnati, OH 45243
Estimated Value: $1,524,000 - $2,465,026
5
Beds
6
Baths
9,063
Sq Ft
$232/Sq Ft
Est. Value
About This Home
This home is located at 8725 Deeprun Ln, Cincinnati, OH 45243 and is currently estimated at $2,105,342, approximately $232 per square foot. 8725 Deeprun Ln is a home located in Hamilton County with nearby schools including Indian Hill Primary School, Indian Hill Elementary School, and Indian Hill Middle School.
Ownership History
Date
Name
Owned For
Owner Type
Purchase Details
Closed on
Oct 22, 2018
Sold by
Chin Rita
Bought by
Chin Clifford
Current Estimated Value
Purchase Details
Closed on
Sep 8, 2011
Sold by
Mccaw Candace D
Bought by
Chin Clifford and Chin Rita
Home Financials for this Owner
Home Financials are based on the most recent Mortgage that was taken out on this home.
Original Mortgage
$868,000
Interest Rate
4.55%
Mortgage Type
New Conventional
Purchase Details
Closed on
Sep 7, 2006
Sold by
Traditions Investments Anderson Ltd
Bought by
Traditions Investments Anderson Ltd
Purchase Details
Closed on
Oct 23, 1999
Sold by
Anderson Ruth M
Bought by
Anderson Ralph G and Ruth M Anderson Trust
Create a Home Valuation Report for This Property
The Home Valuation Report is an in-depth analysis detailing your home's value as well as a comparison with similar homes in the area
Home Values in the Area
Average Home Value in this Area
Purchase History
| Date | Buyer | Sale Price | Title Company |
|---|---|---|---|
| Chin Clifford | -- | None Available | |
| Chin Clifford | -- | -- | |
| Chin Clifford | -- | -- | |
| Traditions Investments Anderson Ltd | -- | None Available | |
| Anderson Ralph G | -- | -- |
Source: Public Records
Mortgage History
| Date | Status | Borrower | Loan Amount |
|---|---|---|---|
| Previous Owner | Chin Clifford | $868,000 |
Source: Public Records
Tax History Compared to Growth
Tax History
| Year | Tax Paid | Tax Assessment Tax Assessment Total Assessment is a certain percentage of the fair market value that is determined by local assessors to be the total taxable value of land and additions on the property. | Land | Improvement |
|---|---|---|---|---|
| 2024 | $20,501 | $568,285 | $357,896 | $210,389 |
| 2023 | $20,468 | $568,285 | $357,896 | $210,389 |
| 2022 | $19,177 | $438,480 | $258,097 | $180,383 |
| 2021 | $18,786 | $438,480 | $258,097 | $180,383 |
| 2020 | $16,374 | $438,480 | $258,097 | $180,383 |
| 2019 | $17,477 | $438,480 | $258,097 | $180,383 |
| 2018 | $17,509 | $438,480 | $258,097 | $180,383 |
| 2017 | $16,708 | $438,480 | $258,097 | $180,383 |
| 2016 | $14,620 | $379,751 | $272,262 | $107,489 |
| 2015 | $14,624 | $379,751 | $272,262 | $107,489 |
| 2014 | $14,507 | $379,751 | $272,262 | $107,489 |
| 2013 | $15,050 | $379,751 | $272,262 | $107,489 |
Source: Public Records
Map
Nearby Homes
- 9357 Main St
- 8866 Humphrey St
- 8865 Cross St
- 6212 Hickory Ridge Dr
- 6205 Hickory Ridge Dr
- 8205 Blome Rd
- 7855 Loveland Madeira Rd
- 309 Indian View Dr
- 8102 Kugler Mill Rd
- 8705 Kugler Mill Rd
- B Second St
- 7675 Loveland Madeira Rd
- 8200 Kroger Farm Rd
- 15 Old Orchard Ln
- 9528 Croton Dr
- 9020 Whisperinghill Dr
- 7936 Keller Rd
- 8845 Montgomery Rd
- 8811 Montgomery Rd
- 9224 Stonewood Ct
- 8700 Deeprun Ln
- 8655 Deeprun Ln
- 8625 Deep Run Ln
- 8625 Deeprun Ln
- 8600 Deeprun Ln
- 8575 Deeprun Ln
- 8575 Deep Run Ln
- 8835 Spooky Hollow Rd
- 8650 Pipewell Ln
- 8525 Deeprun Ln
- 8855 Spooky Hollow Rd
- 8895 Given Rd
- 8825 Given Rd
- 8825 Given Rd
- 8875 Given Rd
- 8825 Spooky Hollow Rd
- 8625 Pipewell Ln
- 8755 Given Rd
- 8500 Deeprun Ln
- 8500 Deep Run Ln