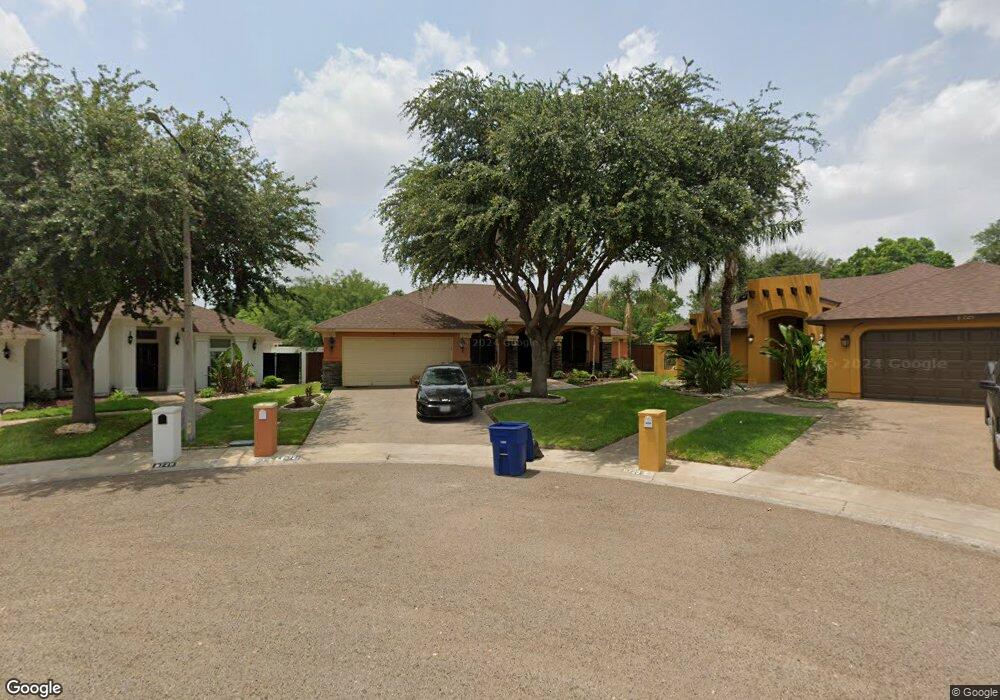
8727 Jerry Loop Laredo, TX 78045
Estimated Value: $297,000 - $346,000
Studio
--
Bath
1,798
Sq Ft
$179/Sq Ft
Est. Value
About This Home
This home is located at 8727 Jerry Loop, Laredo, TX 78045 and is currently estimated at $321,743, approximately $178 per square foot. 8727 Jerry Loop is a home located in Webb County with nearby schools including Trautmann Elementary School, Trautmann Middle School, and John B. Alexander High School.
Ownership History
Date
Name
Owned For
Owner Type
Purchase Details
Closed on
Dec 13, 2022
Sold by
Beatrice Garcia and Manuel Garcia Iii
Bought by
Ramos Graciela and Ramos Jose Tomas
Current Estimated Value
Home Financials for this Owner
Home Financials are based on the most recent Mortgage that was taken out on this home.
Original Mortgage
$333,841
Outstanding Balance
$321,346
Interest Rate
6.75%
Mortgage Type
FHA
Estimated Equity
$397
Purchase Details
Closed on
Jan 29, 2020
Sold by
Castaneda Elena M
Bought by
Castaneda Adan R
Purchase Details
Closed on
Mar 26, 2014
Sold by
Garcia Manuel
Bought by
Garcia Beatrice
Home Financials for this Owner
Home Financials are based on the most recent Mortgage that was taken out on this home.
Original Mortgage
$168,000
Interest Rate
4.32%
Mortgage Type
New Conventional
Create a Home Valuation Report for This Property
The Home Valuation Report is an in-depth analysis detailing your home's value as well as a comparison with similar homes in the area
Purchase History
| Date | Buyer | Sale Price | Title Company |
|---|---|---|---|
| Ramos Graciela | -- | None Listed On Document | |
| Lopez Ramos Graciela | -- | None Listed On Document | |
| Castaneda Adan R | -- | None Available | |
| Garcia Beatrice | -- | None Available |
Source: Public Records
Mortgage History
| Date | Status | Borrower | Loan Amount |
|---|---|---|---|
| Open | Lopez Ramos Graciela | $333,841 | |
| Closed | Lopez Ramos Graciela | $333,841 | |
| Previous Owner | Garcia Beatrice | $168,000 |
Source: Public Records
Tax History
| Year | Tax Paid | Tax Assessment Tax Assessment Total Assessment is a certain percentage of the fair market value that is determined by local assessors to be the total taxable value of land and additions on the property. | Land | Improvement |
|---|---|---|---|---|
| 2025 | $1,518 | $314,218 | $114,305 | $199,913 |
| 2024 | $1,518 | $299,110 | $114,305 | $184,805 |
| 2023 | $5,655 | $284,913 | $107,283 | $177,630 |
| 2022 | $5,695 | $250,838 | $107,283 | $143,555 |
| 2021 | $6,074 | $236,321 | $81,449 | $154,872 |
| 2020 | $5,550 | $215,660 | $81,440 | $134,220 |
| 2019 | $5,698 | $217,070 | $81,440 | $135,630 |
| 2018 | $6,021 | $226,340 | $66,910 | $159,430 |
| 2017 | $5,685 | $217,030 | $66,910 | $150,120 |
| 2016 | $5,317 | $202,990 | $53,540 | $149,450 |
| 2015 | $4,331 | $197,240 | $47,790 | $149,450 |
| 2014 | $4,331 | $189,510 | $44,450 | $145,060 |
Source: Public Records
Map
Nearby Homes
- 8710 Gentlewind Ct
- 402 Saint Croix Dr
- 622 Forest Loop
- 601 Marsh Ln
- 301 International Blvd Unit G-13
- 301 International Blvd Unit B-23
- 301 International Blvd Unit C-19
- 301 International Blvd Unit H-3
- 301 International Blvd Unit H-5
- 301 International Blvd Unit A-14
- 8912 Siller Loop
- 9698 Springfield Ave
- 129 North Ave
- 308 Exeter Dr
- 9031 Lady di Loop
- 8908 Southern Oaks Loop
- 805 Sandy Ln
- 502 Shiloh Dr
- 110 Lagos Ave
- 721 Lindenwood Dr
- 8725 Jerry Loop
- 8729 Jerry Loop
- 8723 Jerry Loop
- 8731 Jerry Loop
- 8721 Jerry Loop
- 8733 Jerry Loop
- 8730 Jerry Loop
- 8512 Alta Mira Dr
- 510 International Blvd
- 8732 Jerry Loop
- 8719 Jerry Loop
- 8735 Jerry Loop
- 8710 Jerry Loop
- 8717 Jerry Loop
- 8708 Jerry Loop
- 8739 Jerry Loop
- 8741 Jerry Loop
- 8502 Alta Mira Dr
- 8713 Jerry Loop
- 8711 Jerry Loop
Your Personal Tour Guide
Ask me questions while you tour the home.