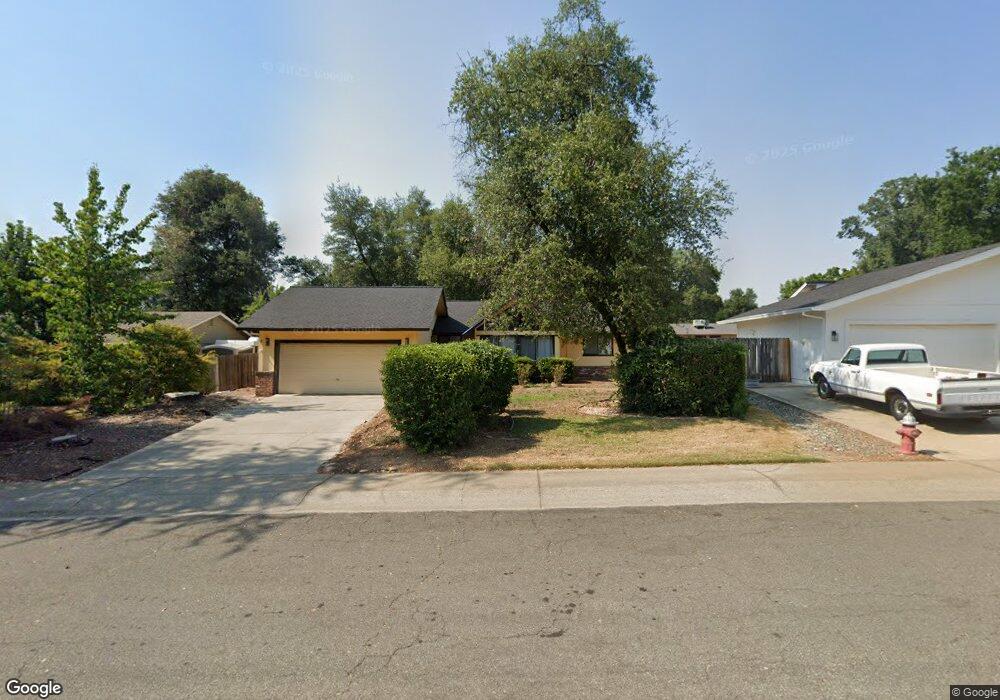
874 Oakmont Dr Unit ONE Redding, CA 96003
Lema Ranch NeighborhoodEstimated Value: $348,000 - $398,000
3
Beds
2
Baths
1,335
Sq Ft
$271/Sq Ft
Est. Value
About This Home
This home is located at 874 Oakmont Dr Unit ONE, Redding, CA 96003 and is currently estimated at $362,010, approximately $271 per square foot. 874 Oakmont Dr Unit ONE is a home located in Shasta County with nearby schools including Mistletoe Elementary School, Foothill High School, and Redding School Of The Arts.
Ownership History
Date
Name
Owned For
Owner Type
Purchase Details
Closed on
Nov 15, 2018
Sold by
Huckoby Patricia and Estate Of Barbara Jones Hersey
Bought by
Ast Jordan Jeffrey
Current Estimated Value
Home Financials for this Owner
Home Financials are based on the most recent Mortgage that was taken out on this home.
Original Mortgage
$205,200
Outstanding Balance
$180,063
Interest Rate
4.7%
Mortgage Type
New Conventional
Estimated Equity
$181,947
Purchase Details
Closed on
Aug 3, 2000
Sold by
Linville Peggie R
Bought by
Jones Cornelia L
Home Financials for this Owner
Home Financials are based on the most recent Mortgage that was taken out on this home.
Original Mortgage
$40,000
Interest Rate
8.11%
Purchase Details
Closed on
Sep 23, 1999
Sold by
Linville Peggie R
Bought by
Linville Peggie R and Peggie R Linville Family Trust
Create a Home Valuation Report for This Property
The Home Valuation Report is an in-depth analysis detailing your home's value as well as a comparison with similar homes in the area
Home Values in the Area
Average Home Value in this Area
Purchase History
| Date | Buyer | Sale Price | Title Company |
|---|---|---|---|
| Ast Jordan Jeffrey | $228,000 | Fidelitynatl Title Co Of Cal | |
| Jones Cornelia L | $124,000 | Alliance Title Company | |
| Linville Peggie R | -- | -- |
Source: Public Records
Mortgage History
| Date | Status | Borrower | Loan Amount |
|---|---|---|---|
| Open | Ast Jordan Jeffrey | $205,200 | |
| Previous Owner | Jones Cornelia L | $40,000 |
Source: Public Records
Tax History
| Year | Tax Paid | Tax Assessment Tax Assessment Total Assessment is a certain percentage of the fair market value that is determined by local assessors to be the total taxable value of land and additions on the property. | Land | Improvement |
|---|---|---|---|---|
| 2025 | $2,769 | $254,334 | $55,774 | $198,560 |
| 2024 | $2,731 | $249,348 | $54,681 | $194,667 |
| 2023 | $2,731 | $244,459 | $53,609 | $190,850 |
| 2022 | $2,654 | $239,666 | $52,558 | $187,108 |
| 2021 | $2,563 | $234,968 | $51,528 | $183,440 |
| 2020 | $2,552 | $232,560 | $51,000 | $181,560 |
| 2019 | $2,532 | $228,000 | $50,000 | $178,000 |
| 2018 | $2,548 | $234,600 | $51,000 | $183,600 |
| 2017 | $2,671 | $230,000 | $50,000 | $180,000 |
| 2016 | $2,493 | $225,000 | $45,000 | $180,000 |
| 2015 | $2,400 | $215,000 | $40,000 | $175,000 |
| 2014 | $2,096 | $185,000 | $40,000 | $145,000 |
Source: Public Records
Map
Nearby Homes
- 965 Willow Brook Ln
- 1110 Grouse Dr
- 1285 Lancers Ln
- 1088 Burton Dr
- 1230 Whistling Dr
- 1090 Gibralter Rd
- 667 Reddington Dr
- 2182 Cadjew St
- 550 Armando Ave
- 790 Volcano View Trail
- 771 Flower Ash Ln
- 1939 Cameo Ct
- 825 Mission Sierra Ct
- 332 Franciscan Trail
- 547 Casa Buena St
- 2093 Victor Ave
- 856 Mission de Oro Dr
- 1637 French Lace Ln
- 592 Mill Valley Pkwy
- 2199 Princeton Way
- 874 Oakmont Dr
- 860 Oakmont Dr
- 888 Oakmont Dr Unit 1
- 888 Oakmont Dr
- 846 Oakmont Dr
- 1865 Tiburon Dr
- 1879 Tiburon Dr
- 1887 Tiburon Dr
- 1851 Tiburon Dr
- 904 Oakmont Dr
- 832 Oakmont Dr
- 881 Oakmont Dr
- 867 Oakmont Dr
- 1907 Tiburon Dr
- 1837 Tiburon Dr
- 895 Oakmont Dr Unit 1
- 895 Oakmont Dr
- 853 Oakmont Dr
- 918 Oakmont Dr
- 818 Oakmont Dr
Your Personal Tour Guide
Ask me questions while you tour the home.