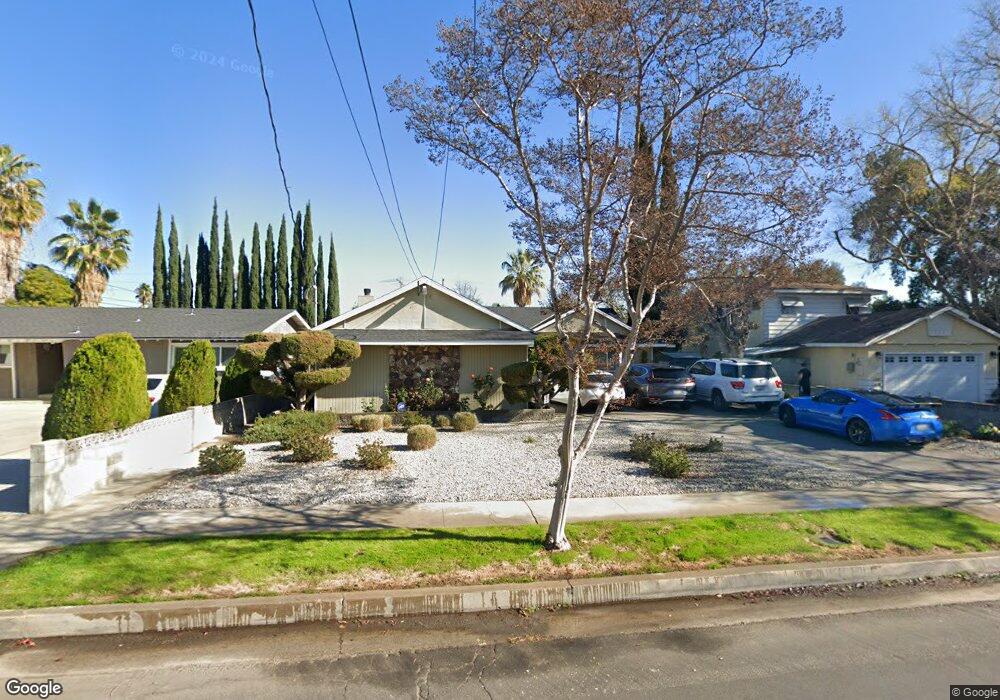
8748 Dempsey Ave North Hills, CA 91343
Estimated Value: $902,245 - $1,009,000
4
Beds
2
Baths
1,518
Sq Ft
$628/Sq Ft
Est. Value
About This Home
This home is located at 8748 Dempsey Ave, North Hills, CA 91343 and is currently estimated at $954,061, approximately $628 per square foot. 8748 Dempsey Ave is a home located in Los Angeles County with nearby schools including Parthenia Street Elementary School, Oliver Wendell Holmes Middle School, and James Monroe High School.
Ownership History
Date
Name
Owned For
Owner Type
Purchase Details
Closed on
Jun 28, 2002
Sold by
Rivera David A
Bought by
Santos Patrick and Santos Maria Vida
Current Estimated Value
Home Financials for this Owner
Home Financials are based on the most recent Mortgage that was taken out on this home.
Original Mortgage
$261,000
Interest Rate
6.51%
Purchase Details
Closed on
Apr 6, 2000
Sold by
Pham Kenny
Bought by
Rivera David A and Rivera Irma B
Home Financials for this Owner
Home Financials are based on the most recent Mortgage that was taken out on this home.
Original Mortgage
$208,590
Interest Rate
8.24%
Mortgage Type
FHA
Purchase Details
Closed on
Aug 28, 1997
Sold by
Jones Lawrence W Co Tr Jones Trust
Bought by
Pham Kenny and Pham Cathy
Home Financials for this Owner
Home Financials are based on the most recent Mortgage that was taken out on this home.
Original Mortgage
$142,200
Interest Rate
7.45%
Create a Home Valuation Report for This Property
The Home Valuation Report is an in-depth analysis detailing your home's value as well as a comparison with similar homes in the area
Home Values in the Area
Average Home Value in this Area
Purchase History
| Date | Buyer | Sale Price | Title Company |
|---|---|---|---|
| Santos Patrick | $290,000 | Investors Title Company | |
| Rivera David A | -- | Lawyers Title | |
| Pham Kenny | $158,000 | American Title Co |
Source: Public Records
Mortgage History
| Date | Status | Borrower | Loan Amount |
|---|---|---|---|
| Previous Owner | Santos Patrick | $261,000 | |
| Previous Owner | Rivera David A | $208,590 | |
| Previous Owner | Pham Kenny | $142,200 |
Source: Public Records
Tax History Compared to Growth
Tax History
| Year | Tax Paid | Tax Assessment Tax Assessment Total Assessment is a certain percentage of the fair market value that is determined by local assessors to be the total taxable value of land and additions on the property. | Land | Improvement |
|---|---|---|---|---|
| 2025 | $3,310 | $419,994 | $243,743 | $176,251 |
| 2024 | $3,310 | $411,760 | $238,964 | $172,796 |
| 2023 | $3,316 | $403,687 | $234,279 | $169,408 |
| 2022 | $3,265 | $395,773 | $229,686 | $166,087 |
| 2021 | $3,215 | $388,014 | $225,183 | $162,831 |
| 2019 | $4,807 | $376,507 | $218,505 | $158,002 |
| 2018 | $4,678 | $369,125 | $214,221 | $154,904 |
| 2016 | $4,465 | $354,793 | $205,903 | $148,890 |
| 2015 | $4,402 | $349,465 | $202,811 | $146,654 |
| 2014 | $4,424 | $342,621 | $198,839 | $143,782 |
Source: Public Records
Map
Nearby Homes
- 15905 Parthenia St
- 16005 Parthenia St
- 16040 Parthenia St
- 15554 Parthenia St Unit 6
- 8521 Gloria Ave
- 15527 Parthenia St Unit 18
- 15929 Sunburst St
- 15724 Chase St
- 16039 Malden St
- 9001 Orion Ave
- 8650 Collett Ave
- 8626 Marklein Ave
- 15735 Nordhoff St Unit 17
- 9038 Orion Ave Unit 107
- 15430 Parthenia St
- 8546 Woodley Ave
- 9047 Langdon Ave Unit 22
- 16052 Columbus Ln
- 15701 Roscoe Blvd
- 8745 Parthenia Place
- 8742 Dempsey Ave
- 8750 Dempsey Ave
- 8758 Dempsey Ave
- 8741 Haskell Ave
- 8757 Haskell Ave
- 8724 Maya Place
- 15833 Londelius St
- 15830 Acre St
- 8738 Dempsey Ave
- 8759 Haskell Ave
- 8800 Dempsey Ave
- 15839 Londelius St
- 15836 Acre St
- 8733 Haskell Ave
- 8720 Maya Place
- 8801 Haskell Ave
- 15830 Londelius St
- 15845 Londelius St
- 8808 Dempsey Ave
- 15842 Acre St