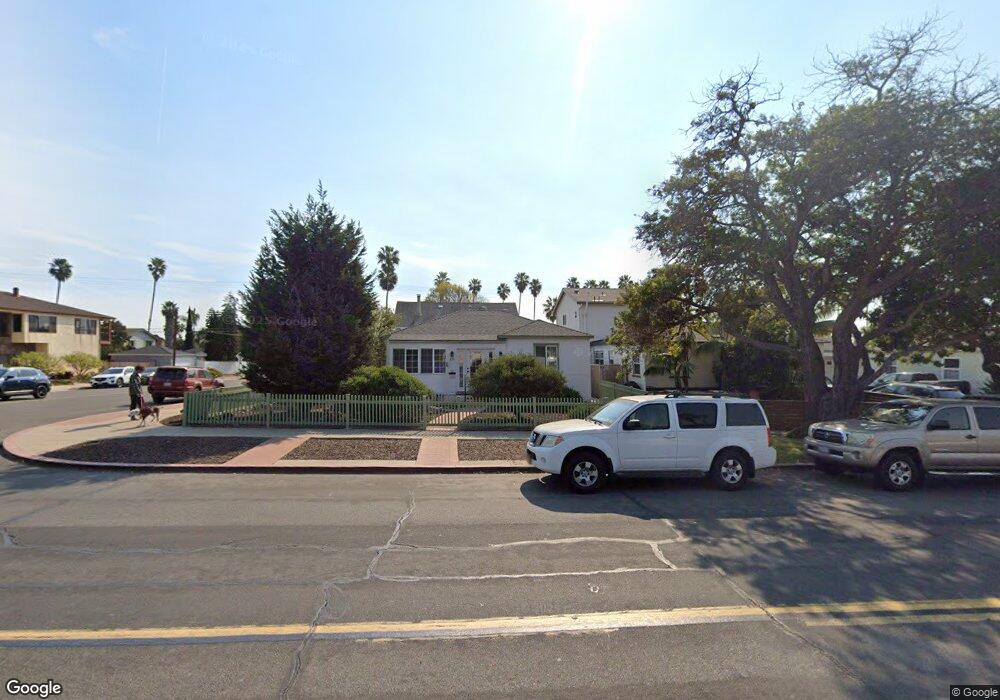
875 Loring St San Diego, CA 92109
Pacific Beach NeighborhoodEstimated Value: $2,094,345 - $2,478,000
4
Beds
3
Baths
1,746
Sq Ft
$1,333/Sq Ft
Est. Value
About This Home
This home is located at 875 Loring St, San Diego, CA 92109 and is currently estimated at $2,327,086, approximately $1,332 per square foot. 875 Loring St is a home located in San Diego County with nearby schools including Pacific Beach Elementary School, Pacific Beach Middle, and Mission Bay High School.
Ownership History
Date
Name
Owned For
Owner Type
Purchase Details
Closed on
Jul 16, 1999
Sold by
Decunea William C & Marjorie J Trust
Bought by
Ryan Donna and Ryan Robert S
Current Estimated Value
Purchase Details
Closed on
Nov 6, 1997
Sold by
Decunea W C and Decunea Marjorie J
Bought by
Decunea Marjorie J and Ryan Donna
Purchase Details
Closed on
Apr 4, 1994
Sold by
Canavier John C
Bought by
Canavier John C and Carr Canavier Cynthia J
Create a Home Valuation Report for This Property
The Home Valuation Report is an in-depth analysis detailing your home's value as well as a comparison with similar homes in the area
Home Values in the Area
Average Home Value in this Area
Purchase History
| Date | Buyer | Sale Price | Title Company |
|---|---|---|---|
| Ryan Donna | -- | -- | |
| Decunea Marjorie J | -- | -- | |
| Canavier John C | -- | -- |
Source: Public Records
Tax History Compared to Growth
Tax History
| Year | Tax Paid | Tax Assessment Tax Assessment Total Assessment is a certain percentage of the fair market value that is determined by local assessors to be the total taxable value of land and additions on the property. | Land | Improvement |
|---|---|---|---|---|
| 2025 | $1,925 | $161,874 | $53,795 | $108,079 |
| 2024 | $1,925 | $158,701 | $52,741 | $105,960 |
| 2023 | $1,878 | $155,590 | $51,707 | $103,883 |
| 2022 | $1,827 | $152,541 | $50,694 | $101,847 |
| 2021 | $1,811 | $149,550 | $49,700 | $99,850 |
| 2020 | $1,788 | $148,018 | $49,191 | $98,827 |
| 2019 | $1,756 | $145,117 | $48,227 | $96,890 |
| 2018 | $1,642 | $142,273 | $47,282 | $94,991 |
| 2017 | $1,601 | $139,484 | $46,355 | $93,129 |
| 2016 | $1,573 | $136,750 | $45,447 | $91,303 |
| 2015 | $1,549 | $134,697 | $44,765 | $89,932 |
| 2014 | $1,524 | $132,060 | $43,889 | $88,171 |
Source: Public Records
Map
Nearby Homes
- 4944 Cass St Unit 604
- 4944 Cass St Unit 407
- 938 Opal St
- 1025 Wilbur Ave
- 972 Sapphire St Unit LA1
- 974 Sapphire St Unit LA2
- 976 Sapphire St Unit LA3
- 751-63 Turquoise St Unit 27-30
- 1154 Sapphire St
- 4767 Ocean Blvd
- 4767 Ocean Blvd Unit 411
- 1059 Agate St Unit A
- 1148 Turquoise St
- 4667 Ocean Blvd Unit 106
- 819 Van Nuys St
- 1045 Van Nuys St
- 5209 Foothill Blvd
- 835 Felspar St Week 6
- 1220 Emerald St
- 1270 Emerald St
- 867 Loring St Unit 69
- 859 Loring St Unit 61
- 905 Loring St Unit 11
- 851 Loring St
- 868 Wilbur Ave Unit 70
- 884 Wilbur Ave
- 862 Wilbur Ave
- 925 Loring St
- 904 Wilbur Ave
- 841 Loring St Unit 47
- 854 Wilbur Ave Unit 56
- 00000 Wilbur Ave Unit 17, 18
- 00000 Wilbur Ave Unit 15
- 914 Wilbur Ave
- 931 Loring St
- 904 Loring St
- 878 Loring St
- 870 Loring St
- 918 Wilbur Ave Unit 22
- 844 Wilbur Ave Unit 46