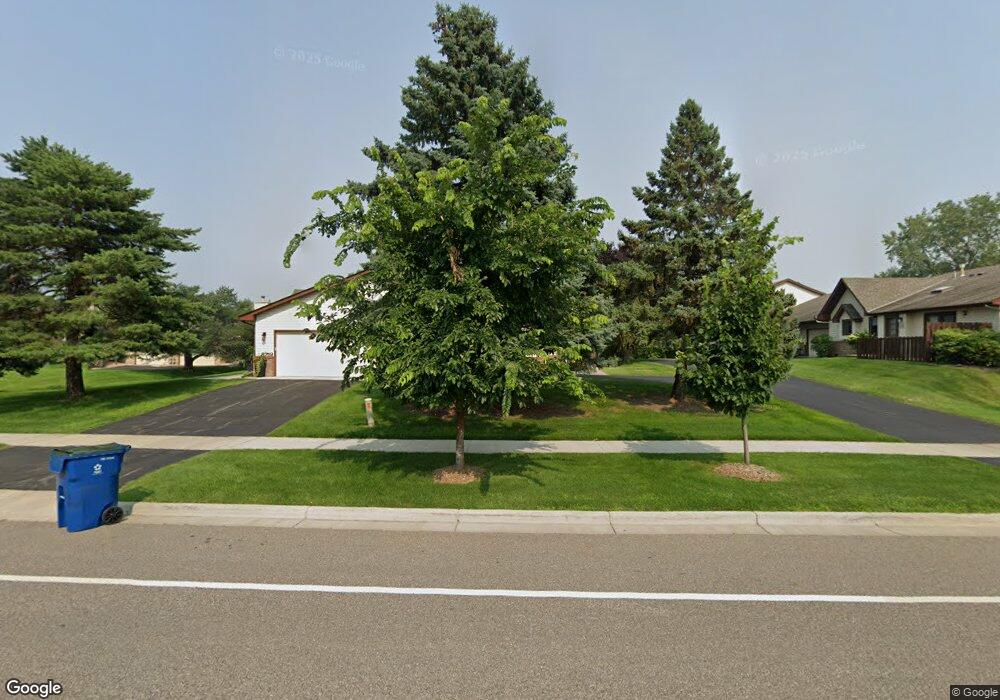
8750 Forestview Ln N Maple Grove, MN 55369
Estimated Value: $255,000 - $293,000
2
Beds
2
Baths
936
Sq Ft
$286/Sq Ft
Est. Value
About This Home
This home is located at 8750 Forestview Ln N, Maple Grove, MN 55369 and is currently estimated at $267,560, approximately $285 per square foot. 8750 Forestview Ln N is a home located in Hennepin County with nearby schools including Rice Lake Elementary School, Maple Grove Middle School, and Maple Grove Senior High School.
Ownership History
Date
Name
Owned For
Owner Type
Purchase Details
Closed on
Apr 23, 2025
Sold by
Ausen Bruce W and Ausen Bruce Warren
Bought by
Dale John P
Current Estimated Value
Home Financials for this Owner
Home Financials are based on the most recent Mortgage that was taken out on this home.
Original Mortgage
$225,000
Outstanding Balance
$224,005
Interest Rate
6.67%
Mortgage Type
New Conventional
Estimated Equity
$43,555
Purchase Details
Closed on
Nov 5, 2010
Sold by
Benavides Rebeca Espinoza
Bought by
Us Bank National Association
Purchase Details
Closed on
Aug 15, 2005
Sold by
Benson Marilyn A
Bought by
Not Provided
Create a Home Valuation Report for This Property
The Home Valuation Report is an in-depth analysis detailing your home's value as well as a comparison with similar homes in the area
Home Values in the Area
Average Home Value in this Area
Purchase History
| Date | Buyer | Sale Price | Title Company |
|---|---|---|---|
| Dale John P | $250,000 | None Listed On Document | |
| Us Bank National Association | $179,993 | -- | |
| Not Provided | $219,900 | -- |
Source: Public Records
Mortgage History
| Date | Status | Borrower | Loan Amount |
|---|---|---|---|
| Open | Dale John P | $225,000 |
Source: Public Records
Tax History Compared to Growth
Tax History
| Year | Tax Paid | Tax Assessment Tax Assessment Total Assessment is a certain percentage of the fair market value that is determined by local assessors to be the total taxable value of land and additions on the property. | Land | Improvement |
|---|---|---|---|---|
| 2024 | $1,889 | $280,000 | $66,900 | $213,100 |
| 2023 | $1,828 | $279,900 | $67,800 | $212,100 |
| 2022 | $1,170 | $277,500 | $51,300 | $226,200 |
| 2021 | $672 | $221,300 | $29,300 | $192,000 |
| 2020 | $824 | $204,100 | $23,900 | $180,200 |
| 2019 | $384 | $213,400 | $42,300 | $171,100 |
| 2018 | $414 | $177,900 | $21,800 | $156,100 |
| 2017 | $351 | $174,000 | $37,000 | $137,000 |
| 2016 | $260 | $167,500 | $41,000 | $126,500 |
| 2015 | $328 | $164,300 | $43,000 | $121,300 |
| 2014 | -- | $147,100 | $43,000 | $104,100 |
Source: Public Records
Map
Nearby Homes
- 11631 88th Ave N
- 11537 88th Ave N
- 8704 Cottonwood Ln N
- 11760 88th Place N
- 8764 Cottonwood Ln N
- 8864 Cottonwood Ln N
- 11879 85th Place N Unit 54
- 9058 Goldenrod Ln N
- 11712 84th Ave N Unit 309
- 14877 106th Ave N
- 8406 Jonquil Ln N
- 12509 88th Ave N
- 8361 Arrowwood Ln N
- 9132 Kirkwood Ln N
- 8215 Deerwood Ln N
- 12598 84th Place N
- 11601 82nd Ave N
- 12769 88th Ave N
- 11540 81st Place N
- 11486 81st Place N
- 8758 Forestview Ln N
- 8748 Forestview Ln N
- 8754 Forestview Ln N
- 8740 Forestview Ln N
- 11651 88th Ave N
- 11651 11651 88th-Avenue-n
- 8746 Forestview Ln N
- 11635 88th Ave N
- 8728 Forestview Ln N
- 8755 Forestview Ln N
- 11647 88th Ave N
- 8747 Forestview Ln N
- 8734 Forestview Ln N
- 11611 88th Ave N
- 8720 Forestview Ln N
- 8785 Forestview Ln N
- 8735 Forestview Ln N
- 11595 88th Ave N
- 8726 Forestview Ln N
- 11607 88th Ave N