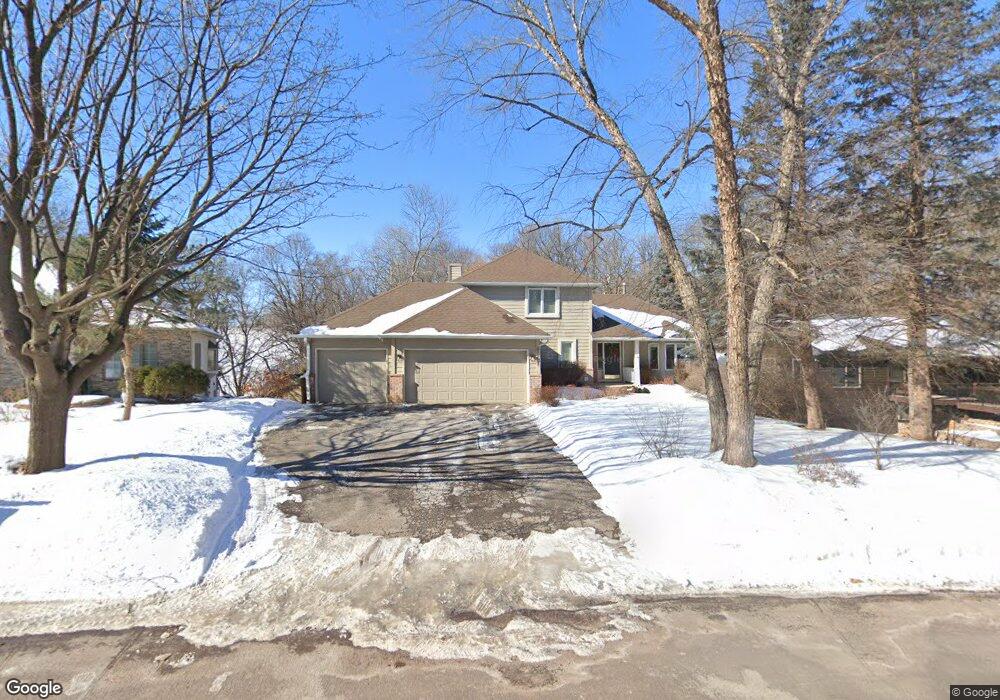
8761 Highwood Way Saint Paul, MN 55124
Alimagnet NeighborhoodEstimated Value: $486,000 - $507,503
4
Beds
3
Baths
3,169
Sq Ft
$157/Sq Ft
Est. Value
About This Home
This home is located at 8761 Highwood Way, Saint Paul, MN 55124 and is currently estimated at $497,126, approximately $156 per square foot. 8761 Highwood Way is a home located in Dakota County with nearby schools including Sky Oaks Elementary School, Burnsville High School, and Gateway STEM Academy.
Ownership History
Date
Name
Owned For
Owner Type
Purchase Details
Closed on
Jul 20, 2022
Sold by
Weaver Marion and Sager Ryan
Bought by
Ibrahim Mamdouh and Ibrahim Ahmed
Current Estimated Value
Home Financials for this Owner
Home Financials are based on the most recent Mortgage that was taken out on this home.
Original Mortgage
$412,087
Outstanding Balance
$392,525
Interest Rate
5.23%
Mortgage Type
New Conventional
Estimated Equity
$104,601
Purchase Details
Closed on
Oct 26, 2021
Sold by
Crumpton Sharon R
Bought by
Weaver Marion Julius Belton and Sager Ryan Jon
Home Financials for this Owner
Home Financials are based on the most recent Mortgage that was taken out on this home.
Original Mortgage
$373,500
Interest Rate
3.01%
Mortgage Type
New Conventional
Purchase Details
Closed on
Feb 28, 2006
Sold by
Dekker Daniel M and Dekker Brenda L
Bought by
Bawden E Carlene and Crumpton Sharon R
Purchase Details
Closed on
Jan 30, 2004
Sold by
Kruse Eric L
Bought by
Dekker Daniel M and Dekker Brenda L
Create a Home Valuation Report for This Property
The Home Valuation Report is an in-depth analysis detailing your home's value as well as a comparison with similar homes in the area
Home Values in the Area
Average Home Value in this Area
Purchase History
| Date | Buyer | Sale Price | Title Company |
|---|---|---|---|
| Ibrahim Mamdouh | $450,000 | -- | |
| Weaver Marion Julius Belton | $415,000 | Land Title Inc | |
| Bawden E Carlene | $325,000 | -- | |
| Dekker Daniel M | $295,000 | -- |
Source: Public Records
Mortgage History
| Date | Status | Borrower | Loan Amount |
|---|---|---|---|
| Open | Ibrahim Mamdouh | $412,087 | |
| Previous Owner | Weaver Marion Julius Belton | $373,500 |
Source: Public Records
Tax History Compared to Growth
Tax History
| Year | Tax Paid | Tax Assessment Tax Assessment Total Assessment is a certain percentage of the fair market value that is determined by local assessors to be the total taxable value of land and additions on the property. | Land | Improvement |
|---|---|---|---|---|
| 2024 | $4,490 | $450,400 | $113,500 | $336,900 |
| 2023 | $4,490 | $449,700 | $113,700 | $336,000 |
| 2022 | $3,646 | $425,900 | $113,500 | $312,400 |
| 2021 | $3,654 | $354,500 | $98,700 | $255,800 |
| 2020 | $3,688 | $336,500 | $94,000 | $242,500 |
| 2019 | $3,602 | $326,200 | $89,500 | $236,700 |
| 2018 | $3,608 | $305,000 | $85,200 | $219,800 |
| 2017 | $3,519 | $290,600 | $81,200 | $209,400 |
| 2016 | $3,335 | $280,800 | $77,300 | $203,500 |
| 2015 | $3,420 | $243,108 | $71,647 | $171,461 |
| 2014 | -- | $256,188 | $69,567 | $186,621 |
| 2013 | -- | $244,198 | $63,840 | $180,358 |
Source: Public Records
Map
Nearby Homes
- 13306 Huntington Cir
- 13101 Heritage Way
- 13345 Huntington Cir
- 2708 Lassen Ct
- 13591 Hollybrook Way
- 13599 Hollybrook Dr
- 13609 Hollybrook Dr
- 13613 Hollybrook Dr
- 110 Pony Ln E
- 13501 Heather Hills Dr
- 13313 Lakeview Dr
- 12924 16th Ave S
- 1408 McAndrews Rd E Unit 8
- 13731 Hollybrook Cir
- 13727 Hollybrook Cir
- The Sophia Plan at Eagle Pointe - Townhomes
- The Amelia Plan at Eagle Pointe - Townhomes
- The Magnolia Plan at Eagle Pointe - Townhomes
- The Nolan Plan at Eagle Pointe - Townhomes
- 1205 E 131st St
- 8759 Highwood Way
- 8763 Highwood Way
- 8757 Highwood Way
- 8765 Highwood Way
- 8755 Highwood Way
- 8767 Highwood Way
- 8766 Highwood Way
- 8753 Highwood Way
- 8769 Highwood Way
- 8735 Hunters Way
- 8752 Highwood Way
- 8751 Highwood Way
- 8755 Hunters Way
- 8718 Highwood Way
- 8716 Highwood Way
- 8750 Highwood Way
- 8749 Highwood Way
- 8720 Highwood Way
- 8765 Hunters Way
- 8775 Hunters Way