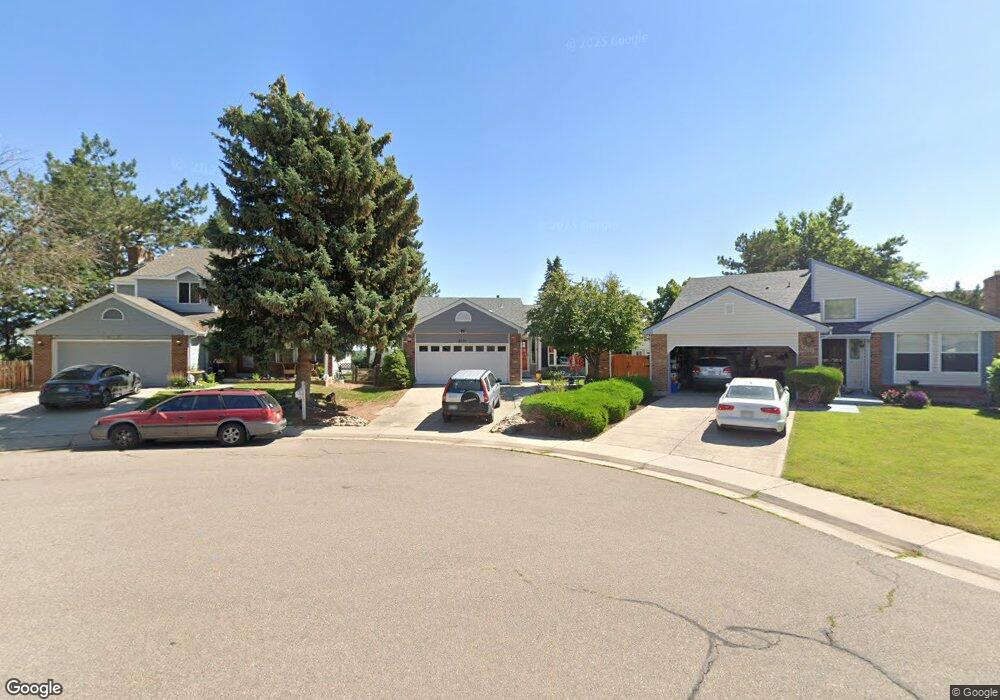
8771 W Quarto Cir Littleton, CO 80128
Stony Creek NeighborhoodEstimated Value: $596,000 - $653,000
3
Beds
5
Baths
1,327
Sq Ft
$471/Sq Ft
Est. Value
About This Home
This home is located at 8771 W Quarto Cir, Littleton, CO 80128 and is currently estimated at $624,881, approximately $470 per square foot. 8771 W Quarto Cir is a home located in Jefferson County with nearby schools including Stony Creek Elementary School, Deer Creek Middle School, and Chatfield High School.
Ownership History
Date
Name
Owned For
Owner Type
Purchase Details
Closed on
Dec 22, 2008
Sold by
Hoskins Roni L
Bought by
Rayment Roni and Rayment Lawrence
Current Estimated Value
Home Financials for this Owner
Home Financials are based on the most recent Mortgage that was taken out on this home.
Original Mortgage
$183,200
Outstanding Balance
$120,753
Interest Rate
6.08%
Mortgage Type
Purchase Money Mortgage
Estimated Equity
$504,128
Purchase Details
Closed on
Oct 15, 2001
Sold by
Hoskins Danny B
Bought by
Hoskins Roni L
Home Financials for this Owner
Home Financials are based on the most recent Mortgage that was taken out on this home.
Original Mortgage
$187,000
Interest Rate
6.84%
Purchase Details
Closed on
May 22, 1998
Sold by
Davis Dwight P and Conde Davis Jovita
Bought by
Hoskins Danny B and Hoskins Roni L
Home Financials for this Owner
Home Financials are based on the most recent Mortgage that was taken out on this home.
Original Mortgage
$170,050
Interest Rate
7.22%
Create a Home Valuation Report for This Property
The Home Valuation Report is an in-depth analysis detailing your home's value as well as a comparison with similar homes in the area
Home Values in the Area
Average Home Value in this Area
Purchase History
| Date | Buyer | Sale Price | Title Company |
|---|---|---|---|
| Rayment Roni | -- | None Available | |
| Hoskins Roni L | -- | -- | |
| Hoskins Danny B | $179,000 | Land Title |
Source: Public Records
Mortgage History
| Date | Status | Borrower | Loan Amount |
|---|---|---|---|
| Open | Rayment Roni | $183,200 | |
| Previous Owner | Hoskins Roni L | $187,000 | |
| Previous Owner | Hoskins Danny B | $170,050 |
Source: Public Records
Tax History Compared to Growth
Tax History
| Year | Tax Paid | Tax Assessment Tax Assessment Total Assessment is a certain percentage of the fair market value that is determined by local assessors to be the total taxable value of land and additions on the property. | Land | Improvement |
|---|---|---|---|---|
| 2024 | $3,430 | $35,022 | $13,622 | $21,400 |
| 2023 | $3,430 | $35,022 | $13,622 | $21,400 |
| 2022 | $3,134 | $31,419 | $10,303 | $21,116 |
| 2021 | $3,174 | $32,323 | $10,600 | $21,723 |
| 2020 | $2,744 | $28,003 | $8,191 | $19,812 |
| 2019 | $2,710 | $28,003 | $8,191 | $19,812 |
| 2018 | $2,611 | $26,058 | $9,359 | $16,699 |
| 2017 | $2,383 | $26,058 | $9,359 | $16,699 |
| 2016 | $2,145 | $22,629 | $6,645 | $15,984 |
| 2015 | $2,060 | $22,629 | $6,645 | $15,984 |
| 2014 | $2,060 | $20,386 | $8,406 | $11,980 |
Source: Public Records
Map
Nearby Homes
- 8785 W Quarto Cir
- 8588 W Quarles Place
- 9088 W Plymouth Ave
- 8594 W Quarto Ave
- 9100 W Portland Ave
- 6852 S Dover Way
- 8242 W Portland Ave
- 6705 S Field St Unit 801
- 6705 S Field St Unit 811
- 6705 S Field St Unit 802
- 9423 W Ontario Dr
- 9448 W Plymouth Ave
- 7296 S Flower St
- 6651 S Dudley Ct
- 9364 W Coal Mine Ave
- 6766 S Holland Way
- 6615 S Field St
- 7408 S Estes Ct
- 9183 W Calhoun Place
- 6765 S Independence St
- 8775 W Quarto Cir
- 8765 W Quarto Cir
- 7019 S Dudley St
- 8761 W Quarto Cir
- 8781 W Quarto Cir
- 7029 S Dudley St
- 8755 W Quarto Cir
- 7008 S Dudley St
- 8760 W Quarto Cir
- 7039 S Dudley St
- 8780 W Quarto Cir
- 8791 W Quarto Cir
- 8751 W Quarto Cir
- 8763 W Quarto Ave
- 7049 S Dudley St
- 7018 S Dudley St
- 8790 W Quarto Cir
- 8795 W Quarto Cir
- 8773 W Quarto Ave
- 7028 S Dudley St